For an ex-investment banking analyst, there aren’t many listed utility companies to talk about, and the few that there are, are either boring or more tied to the past than the future.
On the other hand, the Energiewende, globally, remains one of the more exciting global investment themes.
Global production of coal, oil and gas is about 0.5 zj (million petajoules) which at 2020 prices is worth something like $US3 trillion per year at point of production.
And most of it has to go away by 2035 and the rest not long after. That causes decades of agony for the producers, interrupted by brief periods of joy when shortages emerge.
On the other hand the producers of the replacement products – whether solar cells, EVs or raw materials like lithium, nickel, maybe copper, etc – the software developers, the financiers, the device manufacturers are basically seeing 20 years of decent compound growth in global industry volumes.
For Australia, it’s a two-edged sword and it’s somewhat weird how Australia is like a mini China, albeit with Australian characteristics.
Australia has to give up its position as the third largest exporter of thermal energy, and incidentally possibly the greatest financial beneficiary, as things stand, of the war in Ukraine, but has an opportunity to largely replace that by exports of renewable energy, either in manufactured products, exports of raw materials, exports of electricity via cables to our land constrained regional neighbours, or exports of green hydrogen.
What we are probably going to export first, though, is knowledge and experience. Australia is going to be
the first county in the G20 to move to a largely renewable energy grid.
This, if we don’t f*** it up, may one day be a source of great pride, even if right now it has the conservative engineers turning the anxiety dial up to overload.
Australia is a world leader in terms of the development of a plan to create a largely renewable energy system capable of supplying 200-250 TWh of energy per year and largely eliminating fossil fuels.
Europe and the US are a long way behind. California (260 TWh of annual consumption), is at a similar stage, but if things go wrong California has import capability from the rest of the USA, whereas Australia is on its own. The UK is also planning for zero carbon domestic grid by 2035 but, again, can import 6GW from Europe if it doesn’t work. 6GW isn’t that much, mind you.
Why is Australia ahead?
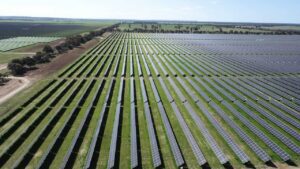
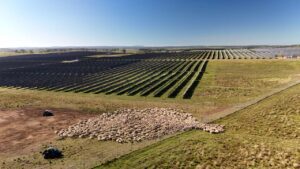
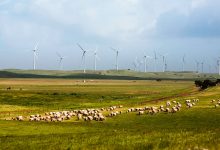
First: we have the resources. In this case, abundant onshore wind and solar locations that can provide bottom quartile cost wind and solar energy.
This is coupled with what is already the clearly world-leading rooftop solar system and one that is increasingly ready with household and community storage to evolve into an integrated and key component of the world leading distributed energy system.
Second: We have the need. Australia’s coal generation should have been replaced, at least in part, a decade ago. Now it is past time.
Third: We have a plan. The ISP has been carefully developed and tested over several years. It shows that a variable renewable energy (VRE) system is the lowest cost way of building our next grid, and that the lights will stay on and that it can be done without much change in the real price of electricity.
Fourth: We have consensus stakeholder acceptance that the ISP Step Change is the most likely scenario. If stakeholders didn’t see the plan as achievable, more or less, there wouldn’t be acceptance.
Fifth: We have policy: The NSW and Victorian governments have clear policies and legislation to support the replacement of coal generation in those regions with firmed VRE. South Australia and Tasmania are
renewable by nature and inclination and Queensland has a target. The new federal government is willing to coordinate and perhaps finance infrastructure, even if it will neither coerce nor incentivise. What’s missing is perhaps more federal policy, and perhaps not enough of a command and control structure.
Transmisison and connection can still be done a lot better than appears at the present time. It just shouldn’t be taking two years for Transgid to move from project specification to project conclusions for a $200 million project in southern NSW and then more time for the AER to review it. Imagine if that sort of process was required for Ukraine to get $200 million from the US. Never mind.
A nerd and the ISP
The ISP is a comprehensive plan and, even though its main conclusions are spelled out in words even the
average Queensland politician can read when they aren’t watching the footy, the inner messages and workings take time to sort through. At least for a slow reader like me.
The ISP will never be realised, in practice, as it stands today. State interests are too strong and/or the ISP did not explicitly weigh factors that states consider important, such as social license issues for onshore wind.
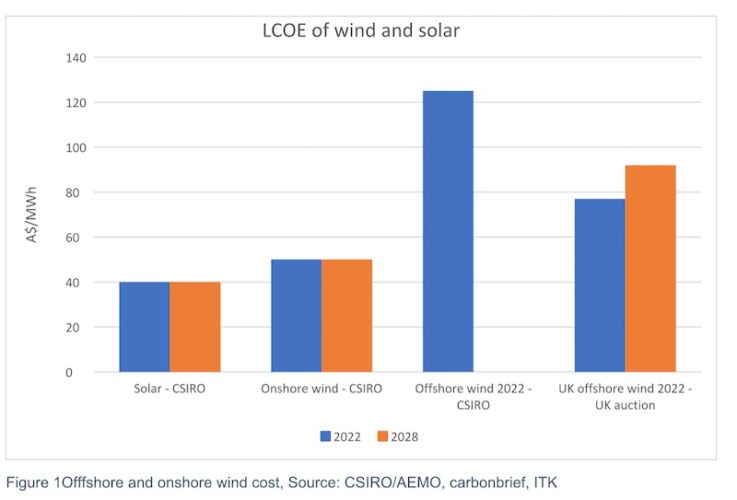
It’s worth looking quickly again at the LCOE (average price required to build and operate a generation facility); ITK considers the CSIRO costs a bit on the conservative side for offshore wind. The assumed capacity factor of 40% will likely be well bettered.
The UK numbers shown below represent recently awarded contracts quoted peculiarly enough in UK 2012 currency which then have to be inflated at actual inflation to 2022 and then estimated inflation to when they will actually be commissioned in say 2028.
Getting back to the ISP
Fortunately, AEMO explicitly provided many of the input data files. Specifically, demand forecast and its components are provided on a half-hourly basis, out to 2050.
There is demand at a P50 and P90 forecast. P50, in my layman’s view, is that given the assumptions on which the demand forecast was based there is a 50% chance of the “true” number being higher or lower and P90 is a 90% chance that the number is above what would happen if all the assumptions were correct.
The following chart is the sum of the OPSO and PV demand series and Mr Panda Python calculations.

Although I am still working on my comprehension of the numbers, the tentative view is that demand increases in 2040 in the middle of the day relative to the shape in earlier years because of storage charging and, to a much smaller extent (something like 0.5 GW), due to coordinated EV charging.
I made the following figure using the half-hourly demand numbers. It shows for an average day – that is the average by half-hour of all half hours in the selected year, of demand – VRE expressed in GW. It is meant to show how the use and need for storage and firming will evolve on average through time under the step change scenario.

In 2040 on an average day there is about 15GW of excess production in the middle of the day and 10-15GW of demand in excess of production in the evening peak.
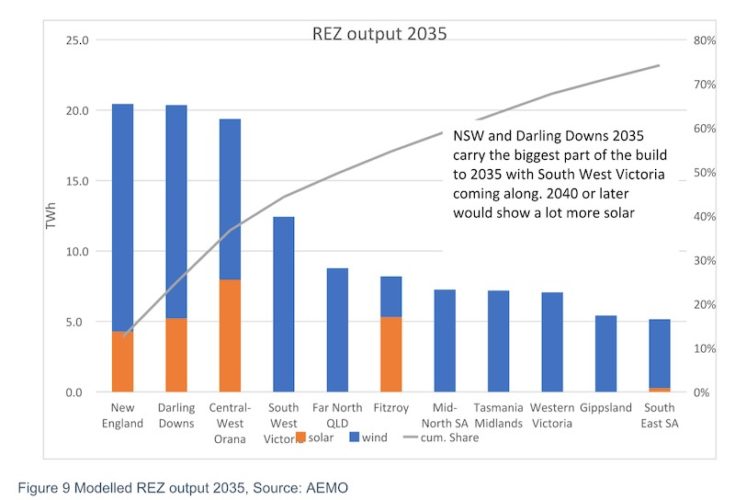
Similarly, as discussed in the last note, AEMO has provided wind and solar traces for all the REZs identified in the ISP (see section at end of note for a bit more on this).
Not only that but there is also a table of the capacity installed by the AEMO model in each REZ in each year, and the expected output. I wanted to put the output from that file on a map but it will have to wait for another meeting with Mr Panda Python.
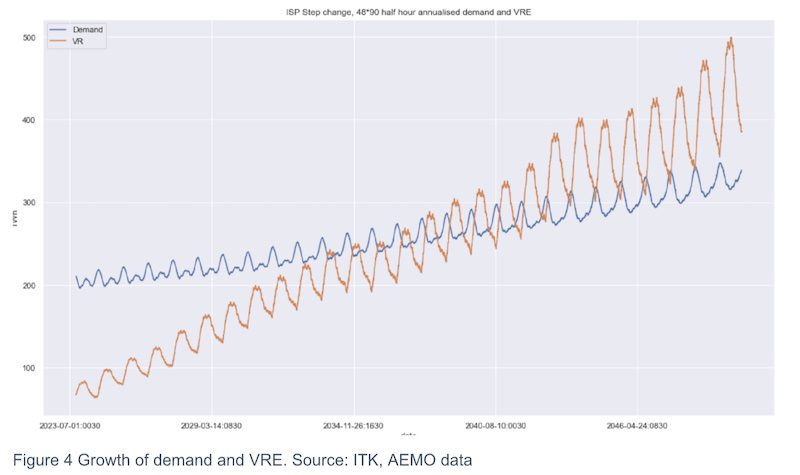
Moving on to a halfhouly moving average and the growth in VRE, the figure below shows a moving half hourly window of demand and VRE on a 90 day annualised basis, that is 90 days *48 half hours per day, multiplied by 365/90.
The average is calculated, and then we repeat the calculation by dropping one half hour from the top of the window and adding the next sequential half hour at the bottom.
The resulting graph is interesting (to me as an analyst even if to no one else) because it shows the projected rise in VRE and, using the 90 day window, there is a clear view of the seasonality of the output.
Some of the gross VRE output is expected to be spilled, which may explain why the total eventually moves well beyond projected demand. By 20501 the ISP shows about 415TWh of VRE output against demand of less than 350TWh. In addition there is still about a combined 16TWh of hydro and gas output.
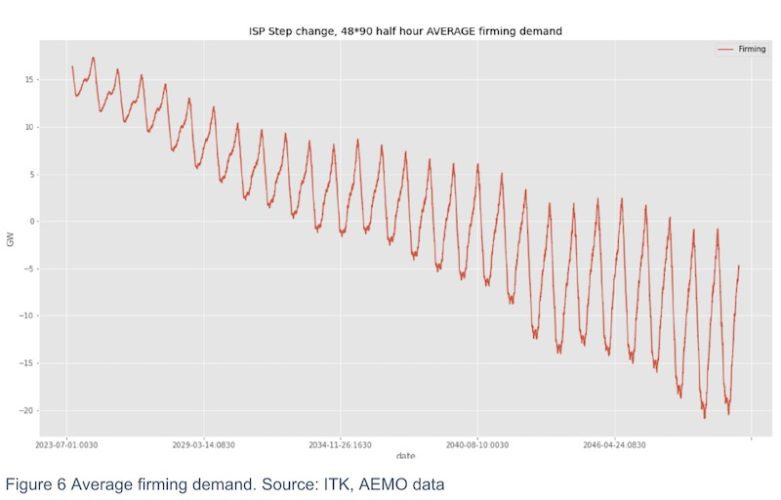
Similarly, we can get a projection of firming power, that is for any 30 minute interval the difference between demand and VRE power. Note that demand used here is total demand which includes rooftop + demand for storage ie (operational demand + rooftop supply).
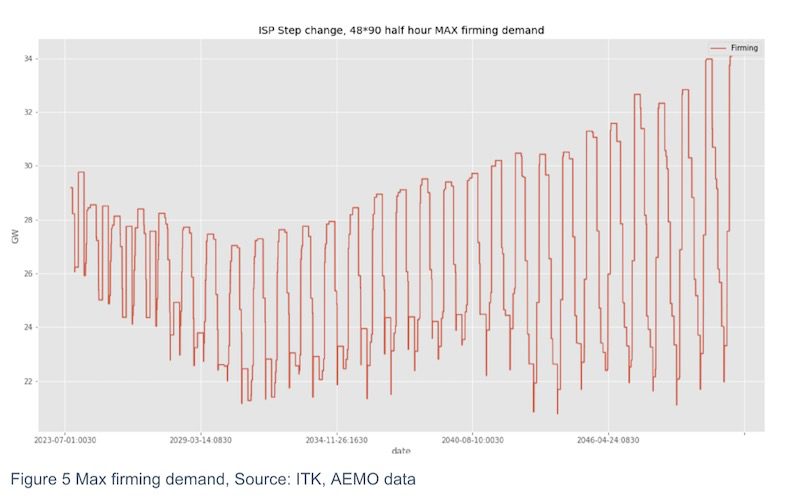
I’ve chosen to use the maximum difference between demand and VRE supply in this rolling wind. That tends to increase as demand grows because there will always be half hours where there is almost no wind or solar.
The average firming demand reduces as the VRE supply grows. And the difference has implications for what sort of firming will be needed as the VRE supply increases relative to demand.
VRE production = demand from about 2038
On the numbers as output from this model, VRE is roughly equal to demand from about 2038. Selecting just 2038 from the output shows that the expected seasonality pattern; i.e. over-production of VRE in Spring and to a lesser extent Summer is offset by under production in Winter and Autumn.
This was a result that we have all been thinking about for some time. Not just the infamous Dunkelflaute but a
prediction that management of winter demand will move to centre stage. Demand can still spike like crazy in summer but solar production will tend to manage it in the middle of the day. In winter, storage and firming will earn their keep. And if 2022 is a guide to the future, what a keep it would be. If only….
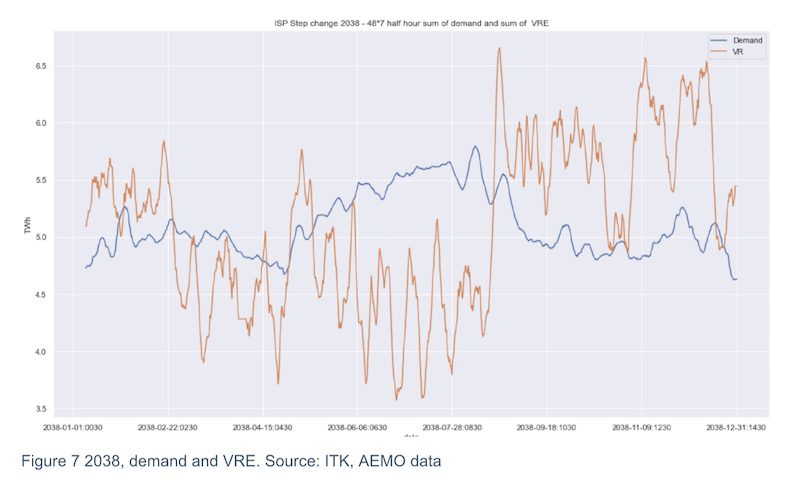
Note that this figure is only demand, compared to VRE; i.e. the sum of wind, solar and rooftop. There is no hydro in there, no batteries, no pumped hydro, no gas, no coal.
Conceptually, to the extent that AEMO models demand response in its demand projection, then there is some demand response. In practice there possibly isn’t any demand response in the model. Through June and July 2038 the output from Mr Panda Python shows an average daily firming pattern as follows:
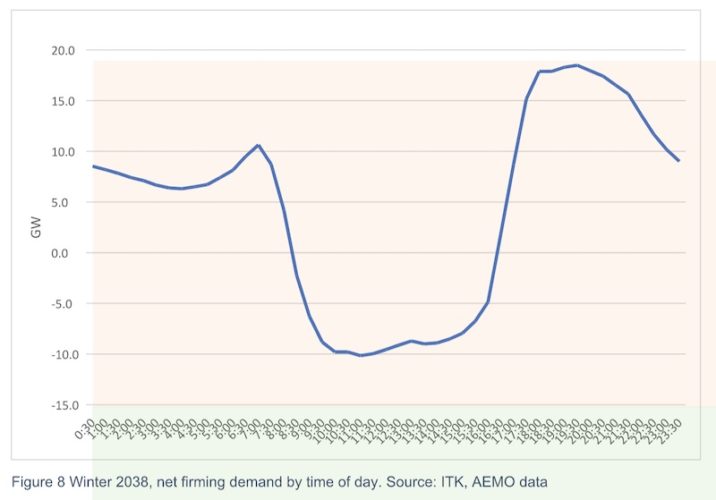
Average firming demand is around 9GW during this time and total energy required is about 13TWh. That’s the demand in excess of production so it has to be procured from hydro, from seasonal storage and from gas or maybe by then green hydrogen REZs and traces.
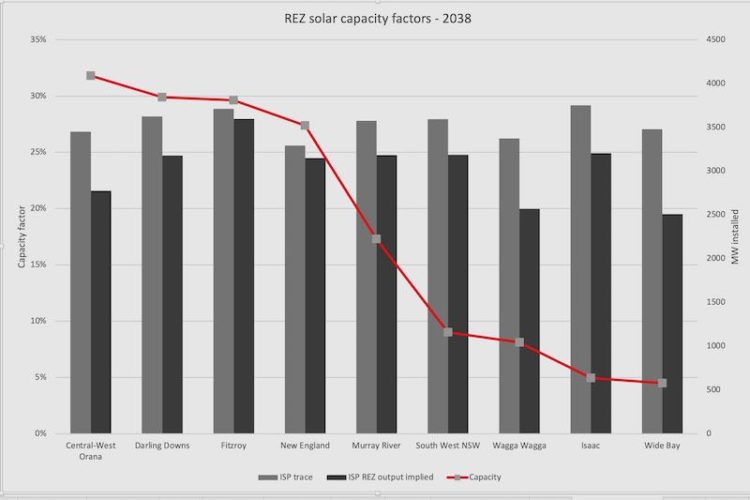
The wind and the solar components of VRE were calculated as AEMO’s estimate of the wind/solar capacity factor in a particular half hour for a zone times the amount of capacity that AMEO installed in that year in that zone for each fuel.
This worked fine for wind producing average capacity factors of about 36% but for solar, for reasons that I don’t understand, I ended up with capacity factors of close to 27%, which seems reasonable for single axis tracing and most of the solar in Queensland and NSW, but if you look at AEMO’s modelled output the implied capacity factor is more like 23%.
In the time available (two days of looking and sleeping with my python/pandas code) and showing my age I couldn’t resolve the discrepancy, and so using standard investment banking research best practice I just multiplied my calculated solar total by 88% to get the numbers close to those of AEMO in aggregate on full FY basis.
Nevertheless, for FY2038, by which time the ISP model installs a reasonable amount of solar, the discrepancy between my calculation of solar capacity factors based on half hourly ISP solar trace data and the implied capacity factor AEMO publishes from the REZ output (as generated) by zone and fuel and REZ MW installed are shown below.
A sample solar trace taken directly but semi randomly from the Orana trace file provided by AEMO is: