I have an intriguing puzzle for inquisitive RenewEconomy readers.
What is it about the diagram below that looks a bit odd?
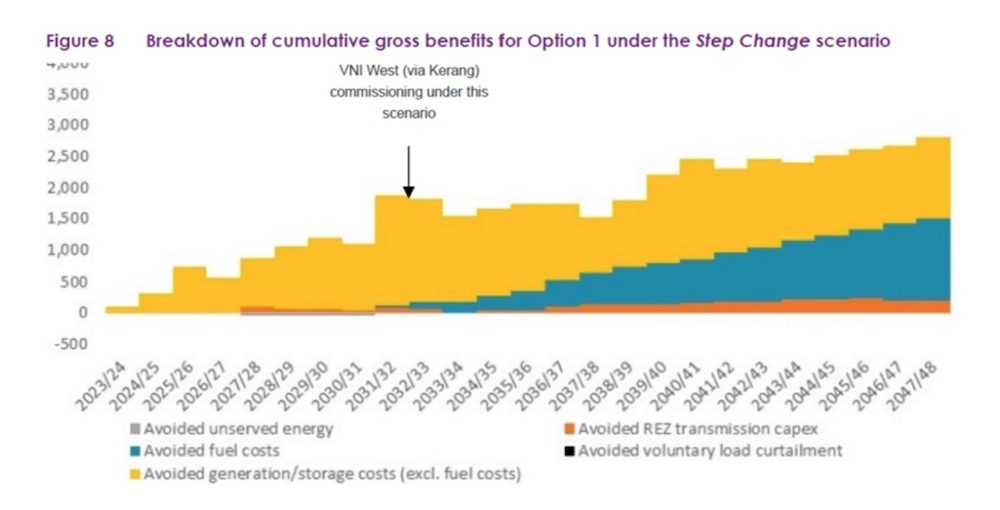
The diagram shows the cumulative gross benefits of the proposed Victoria to New South Wales Interconnector (VNI West), extracted from the Project Assessment Draft Report (PADR), issued on 26 July 2022 by AEMO Victorian Planning and TransGrid.
Psst, for a clue, note the arrow and caption indicating VNI West’s commissioning date at the end of 2031/32.
Finished head-scratching?
When I first looked at the diagram I couldn’t figure out how VNI West would accumulate a staggering $1.9 billion in benefits from avoided costs before it is commissioned.
Also, I couldn’t comprehend how those pre-commissioning benefits, accrued over nine-years, could amount to two-thirds of all benefits over the entire 25-year modelling period ($2.8bn by 2047/48). That is, how could pre-commissioning benefits stack up to be twice post-commissioning benefits, and in half the time? Bewildering!
To add to my puzzlement, VNI West won’t be approved for construction till the completion of its early works, in 2026. But the diagram indicates that, by that time, benefits of $0.7 billion will have accumulated. This staggering achievement, prior to approval and in just four years, accounts for a quarter of the benefits over the 25-year modelling period!
To find out how VNI West will achieve such confounding outcomes I delved into the modelling.
The PADR model compares expected changes in the NEM from building VNI West against the Base Case (i.e. no VNI West) and determines the ensuing ‘benefits’.
As seen from the diagram, virtually all of the benefits supposedly accruing prior to commissioning come from avoided generation/storage costs (yellow bars). After commissioning, those avoided generation/storage costs decline, but are more than compensated for by avoided fuel costs (blue bars). Other benefit categories are immaterial.
The nub of these avoided costs is the assumed changes in the composition and operation of the NEM stemming from VNI West being built, compared with the Base Case.
And this is where the modelling gets very cunning, though seemingly implausible.
It’s a little convoluted, but bear with me.
The model assumes that the very knowledge today that VNI West will be commissioned in 2031/32 results in:
- some developers deferring investments in renewables and storage in the nine years prior to commissioning, resulting in ‘avoided capital costs’ of $1.9bn (yellow bars)
- the reduced generation from renewables is offset by increased coal generation, at no extra capital cost, as it is already built. Extra coal fuel costs are offset by less gas generation fuel costs – sneaky
- then, after VNI West is commissioned, the developers decide to build the deferred renewables and storage, which results in less gas generation, ‘avoiding’ $1.3bn in fuel costs up to 2047/48 (blue bars). As a further twist, the model assumes the developers will build the deferred renewables in different, higher quality locations, avoiding further costs
- beyond 2047/48 it is assumed that avoided gas fuel costs continue for the 50-year economic life of VNI West, even though there should be no fossil fuel generation by 2050, and hence no fuel costs to avoid thereafter
The PADR diagram below shows the reduced output from renewables (green and yellow bars for wind and solar below the line) replaced by coal (brown and black bars above the line) until VNI West is commissioned, then the subsequent increase in renewables (above the line) and reduced gas (light blue and ochre bars below the line) after commissioning.

If you think these perverse modelling assumptions/outcomes seem a tad contrived and far removed from what would happen in reality, I suggest you read the PADR submissions by VEPC, EUAA, EGA and me for more details.
There is something else puzzling about the first diagram (Figure 8): The ‘cost’ of 16 million tonnes of CO2 emissions from extra coal generation till 2033 is missing.
Even though the model concocts an equivalent reduction of CO2 emissions over the remainder of the 25-year period from less gas generation, the time value of emissions has not been included – at an estimated cost of $0.4bn to $1.9bn depending on the carbon ‘cost’ (VEPC). Let alone the imperative to reduce emissions sooner rather than later for the sake of the planet.
Without these cunning assumptions and omissions the gross benefits from VNI West would be minimal pre-commissioning, less post-commissioning, and negligible if any after 2050.
The PADR’s forecast net benefit for building VNI West of $0.7bn is based on implausible assumptions far removed from what would occur in reality. It is far more likely that the cost of VNI West (latest estimate of $3.3bn) will well exceed its benefits.
How can VNI West be justified if it results in a net cost to consumers, a slowing of the transition to renewables, a greater use of coal, and higher CO2 emissions for the next decade? Aren’t such outcomes the very antithesis of government policy.
It’s all very puzzling.
Ted Woodley is a former managing director of GasNet, PowerNet and EnergyAustralia