Like other kibitzers, ITK has a number of rules of thumb that every policy maker needs to keep in mind as Australia decarbonises.
Rule number 1 is to build the new supply first. It is better to pay producers when returns are below those required rather than deal with the risks of the lights going out.
The trouble with this rule is that as soon as enough new supply is announced, some thermal generator throws in the towel and closes before the new supply can be built.
More than that, the thermal sector starts behaving like the “the wounded bull” in what is perhaps now Powerlink CEO Paul Simshauser’s most enduring image. To be fair this risk was also noted by the Australian Energy Council in its initial analysis of the NSW Roadmap
“It is intuitive that subsidising early entry through de-risking it will create an oversupply that in turn suppresses prices for customers and existing generators. It would seem however that this modelling does not anticipate the suppressed prices driving the disorderly exit of existing plant, that would in turn create a strong price rebound.” Source: AEC 2020
It’s hard to see what can be done about that. No matter how it’s dressed up the idea is to get the coal generators to close. New supply takes years to build. The gap years in the middle become the playground of the installed generators.
A capacity market could of course incentivise generators that might close to stay open, the trick being to ensure that the capacity market doesn’t make the long term problem worse and equally any capacity market incentivises new, zero carbon, dispatchable capacity.
Frankly, it may be better to just negotiate with generators as the Victorian Government has done with Yallourn. It’s not very efficient, not even fair, but it keeps average prices down while the new supply is built.
Power prices in Queensland have averaged $178/MWh over the last 30 days and those in NSW over $120/MWh.

Futures prices in NSW are over $100/MWh right out to 2025.
| Baseload futures $MWh | FY18 | FY19 | FY20 | FY21 | FY22 | FY23 | FY24 | FY25 |
| NSW | 96.6 | 88.9 | 71.6 | 64.8 | 96.1 | 136.3 | 125.2 | 117.3 |
| Qld | 88.1 | 80.7 | 54.0 | 62.1 | 120.5 | 119.7 | 96.5 | 77.6 |
| SA | 124.6 | 58.3 | 58.3 | 44.7 | 66.2 | 83.6 | 72.5 | 64.6 |
| Vic | 108.8 | 110.4 | 73.9 | 46.0 | 57.8 | 65.4 | 57.8 | 56.2 |
Figure 2. Futures prices. Source: NEM Review
In NSW, the pending closure of Eraring reduces supply significantly, and NSW will have to scramble to replace that supply, but in QLD, on the surface nothing is happening.
It now seems to me unlikely that Mick De Brenni the Queensland Energy Minister, will make his much anticipated energy statement detailing how Queensland can make 1 + 1 add up to 11 by simultaneously getting renewable energy to 50% by 2030, keeping all the coal stations open and decarbonising after all “its what Queenslanders want”.
And, as we all know, it’s important that Queenslanders get what they want, even if that appears to be a load of old cobblers
Demand is up and coal generation down a bit
The following table tries to summarise what’s been happing in NSW and QLD. It shows the change in demand and supply in the 7 Mar to 5 April time period for 2022 compared to the PCP.
A combination of a 623 MW demand increase (3.3%) and 400 MW reduction in coal means another 1000 MW of supply from other sources is required.
| Change 2022 from same period last year | ||||
| MW | NSW | QLD | Combined | |
| Demand | 145 | 478 | 623 | |
| Coal generation | -400 | -2 | -402 | |
| Demand change from non coal | 544 | 480 | 1,024 | |
| Sourced from | ||||
| Gas | 288 | -1 | 287 | |
| Rooftop | 128 | 351 | 480 | |
| Solar | 247 | 83 | 330 | |
| Hydro | 57 | 82 | 139 | |
| Wind | -46 | -86 | -132 | |
| Total other supply change | 674 | 429 | 1,104 | |
| Net change in interstate demand (NSW), supply (QLD) | -130 | -51 | 79 | |
Figure 3. Change in demand and supply from last year. Source: NEM Review
This has been made up by substantial increases in solar of all sorts (over 800 MW), with other items (gas, hydro and wind) making up the balance.
In NSW’s case the increase in non coal supply more than made up for the coal supply loss but in QLD there was a small net reduction. This means in practice, but not shown, that there is a marginal reduction in average exports from Queensland to NSW.
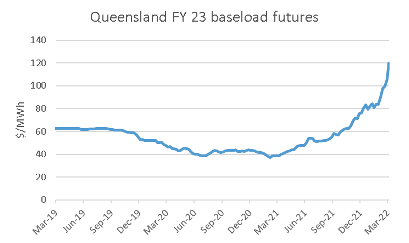
Remember, it’s only a 30 day period that we analyse, but equally the rise in futures prices, suggests things will remain out of whack, particularly in Queensland.
Consider FY23 base load futures in Qld which traded between $60/MWh and $40/MWh for the last 3 years but has suddenly shot up to $120/MWh. Queensland is an energy intensive State.
The prices in Queensland must only be temporary, but temporary can mean a year or two. Temporary because new supply is cheaper.
The LCOE (average price required to justify investment) of firmed new supply, that is wind and solar with a firmed component are no more than say $65/MWh or $70/MWh at the most. For a discussion of how I get that number send me a stamped postcard with your address on the back.
Hard to have confidence in Queensland
QLD is a terrible State for the electricity value chain, and that’s despite the fact that in general projects in QLD tend to get started and finished more or less on time.
The reason it’s terrible is very simple. The QLD Govt owns most of the generation and no retailer can ever be completely certain what policy the QLD Govt will instruct its generators to follow.
This problem might be less if the QLD Govt had clear, credible targets and policies to achieve them. But it doesn’t. There is still both a policy and a credibility gap. The two go hand in hand. And the history suggests caution is warranted.
Over the past 10 years the QLD Govt has used market power to push prices right up squeezing Origin, a retailer badly. After a couple of years the QLD Govt just issued a Ministerial Directive and QLD generators stopped using their market power.
The QLD Govt decided there was too much competition in Queensland and combined 3 State owned generators into two. Then it decided prices were too low and made each of Stanwell and Tarong shut down some units for a while till prices improved.
Then it decided to put most of “clean” generation into a new Govt owned company “Cleanco”, albeit that Cleanco was also given a gas generator Swanbank E. Swanbank E is out of service until September, and it may be that as a result, Cleanco sold its gas into the LNG market.
QLD Govt policy towards electricity generation has to be clearer before the industry can progress. Some in the industry think it’s the ETU in QLD that actually sets the policy.
If the Government had the nerve, QLD has renewable energy resources superior to most other regions and could transition from coal relatively easily.
The Government is committed to owning the main generators, transmission and distribution.
QLD Govt policies include:
- 50% of generation from renewable sources by 2030;
- By 2030 reducing emissions 2005 level emissions by 30%. As with the Federal Govt, the Queensland Govt, if it talked about how things were going, would point out the big reduction due to land use. However most of us in the industry think that land use changes, although not necessarily always complete garbage are at best a side show and more generally used as an excuse to shirk the real job. Queensland’s energy related emissions have increased from 100 mt in 2014 to 120 mt in 2019 and nothing much else has changed.
- Queensland Govt has no policy about what it’s going to do with its coal fired generators. In fact, the Queensland Govt runs what can mostly be described as a Stalinist policy. In that anyone inside the tent, such as ex Stanwell CEO Richard Van Breeda, is sacked for talking out of turn. In May 2021 Van Breeda mentioned at an industry formum that Tarong and Stanwell Power might have to close early. Two days later he was sacked. I guess its not quite Stalinist because in Stalinist Russia he’d have been shot or sent to Siberia. But nevertheless sacking a CEO for stating the truth tells me that De Brenni has no stomach for facts or useful discussion. De Brenni is expected to deliver a major energy policy statement in the current quarter, that is before June 30, but his treatment of De Breda indicates that a credible policy is unlikely to emerge.

Queensland renewable energy rolls out in a very ad hoc fashion. The State owned generators basically just call for some PPAs or announce projects with no particular rhyme, reason or timetable, although one suspects politics plays a part.
So before the last election we had Cleanco announcing announcing a 350MW solar project PPA with Neoen and a PPA for 400MW of the 1000MW McIntyre wind farm, and its own 100MW facility within that hub.
More recently Stanwell has agreed to a PPA for 384/450MW from the Clark Creek wind farm.
Cleanco also has PPAs with 3 other wind farms, Kaban Green Power hub, Karara Wind farm and Dulacca wind farm. I don’t wish to denigrate its achievement, simply to point out that this is not a policy. It’s just randomly building a bit more capacity from time to time.
Queensland’s policy is such that when a coal generator blows up, they decide to rebuild it. No explanation of how the rebuild fit into the Govt’s policy was required because there is no policy.
Easy peasy. Except when power prices go through the roof and industry confidence is low.
Gordon Wymer at Snowy speaks of low confidence by the industry in Tasmanian wind due to uncertainty about Marinus Link, but for me the twists and changes in QLD and the fact that its probably the near term interests of the ETU that drive things in Queensland make Tasmania look relatively attractive.
A firm legislated target with a policy instrument to achieve it is the way forward.
Recently, Powerlink, the Queensland transmission operator, held an information webinar and announced… pretty much nothing.
The Webinar ended early when there was some alarm at Powerlink HQ but if I didn’t know better I’d have thought the alarm was set off by management to kill of the discussion, so we could all go off and have a beer and talk about the footie.
About the only thing I took from that webinar was that Queensland, or at least Simshauser, CEO of Powerlink and likely a key player in the QLD system, didn’t feel that the ISP necessarily reflected the path that Queensland would actually take.
In short, Queensland so far has shown no commitment.
QREZ
Queensland also has an emerging Renewable Energy Zone [REZ] “policy” and received expressions of interest for 60 GW of capacity. Based on webinars I have listened to QLD’s QREZ policy is more conceptual than anything else.
For instance the three Queensland REZ study areas cover most of the populated part of QLD. To date there is no firm discussion for instance of how output from the Northern QREZ (about 1000 km long within the zone and another 1000 km from Mackay to Brisbane) would get to Southern load.
However, the main issue likely to hold back REZ development is the lack of firm targets and policies to achieve them. The NSW plan calls for 12 TWh of renewable energy by 2030 + 2 GW of firming.
This led to the closure of Eraring. NSW consumers are going to have to pay higher prices between now and when the renewable energy starts being commissioned but, in my opinion, there can be a lot of confidence in the 2030 outlook. In QLD, the lack of policy makes the targets less credible.

QRET and Queensland generators
One of the biggest changes in the 2022 ISP as compared to previous versions and also in contrast to the actual experience is the assumption that demand for electricity will grow reasonably well over the next decade, driven essentially by electrification of industrial processes and electric transport.
This means that there is less pressure on existing generators to close in the face of State based renewable energy targets.
For instance the Step Change scenario has QLD demand growth of 1.5% CAGR or 8 TWh by 2030. That’s maybe 3000MW of wind and solar.
The following table purports to show that in many respects the QRET is an easy goal for QLD. They just have to make sure there is 650 MW of rooftop installed every year and another say 650-700 MW of utility wind and solar.
That part is easy. The part the QLD Govt has so far been unable to be truthful about is that about 2.5 GW of coal generation will have to close. That’s just to meet the QRET but by today’s standards the QRET is not very ambitious.
| QRET task | ||||
| TWh | 2021 | 2030 | Growth | CAGR |
| Production | 62 | 70 | 8 | 1.5% |
| VRE required for 50% | 31 | 35 | 4 | |
| Less Actual renewables yr to Jun 21 (Note A) | -11 | |||
| Balance to be procured | 20 | 24 | ||
| Of which behind the meter (note C) | -7 | -7 | ||
| Remaining utility requirement (note B) | 13 | 17 | ||
| Actual Thermal production yr to Jun 21 | 51 | |||
| Of which coal | 46 | |||
| Thermal for 50% | 31 | 35 | ||
| Required reduction from FY21 | 20 | 16 | ||
| Approximate MW to be retired | 2500 | |||
| Note A | ||||
| Fy21 Renewable production | ||||
| Wind | 2 | |||
| Solar | 3 | |||
| Rooftop | 5 | |||
| Hydro | 1 | |||
| Total | 11 | |||
| Note B Utility VRE investment required | ||||
| Low | High | Average | ||
| Increased VRE required (Twh) | 13.2 | 17.2 | 15.2 | |
| GW of wind & solar required by 2030 | 4.7 | 6.1 | 5 | |
| MW per year | 587 | 766 | 676 | |
| Note C Rooftop growth | ||||
| Expected MW per year | 500 | 800 | 650 | |
| 8 year total | 4000 | 6400 | 5200 | |
| Output per year TWh | 5.3 | 8.4 | 6.8 |
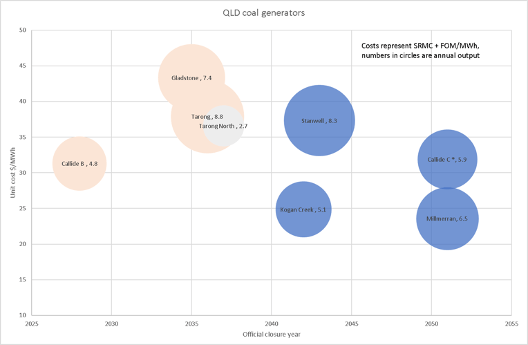
Figure 7. QRET analysis. Source: ITK
In general QLD coal generators are much less exposed to export coal prices both in the short and long term than NSW generators. However there is still some exposure. The following chart uses numbers from AEMO for costs, but obviously if you were exposed to spot coal prices then costs would be much higher.