The growing uptake of rooftop solar PV – driven in part by the huge jump in wholesale electricity prices and retail bills in the past year – has taken the biggest bite yet out of the fossil fuel industry’s energy lunch.
In an ironic twist to the cartel-like behaviour of the fossil fuel industry in the midst of the confected energy “crisis” in 2022, demand for coal, and particularly gas, has been eaten away by the power of households, with rooftop PV sending demand down to record lows, and forcing a big fall in prices.
According to the Australian Energy Market Operator’s latest Quarterly Energy Dynamics report, rooftop solar, or distributed PV, recorded its highest year on year growth ever (up by an average 431MW).
It meant that the average “operational” demand on Australia’s main grid – known as the National Electricity Market – fell to its lowest Q2 average since Tasmania joined the market in 2005, even though “underlying” demand jumping to its highest level since 2016 thanks to a cold snap in May.
In short, more power was consumed on the grid, but a much greater share came from the consumers themselves – households and businesses. Rooftop solar accounted for 7.9 per cent of total generation during the quarter, more than gas and nearly equal with hydro.
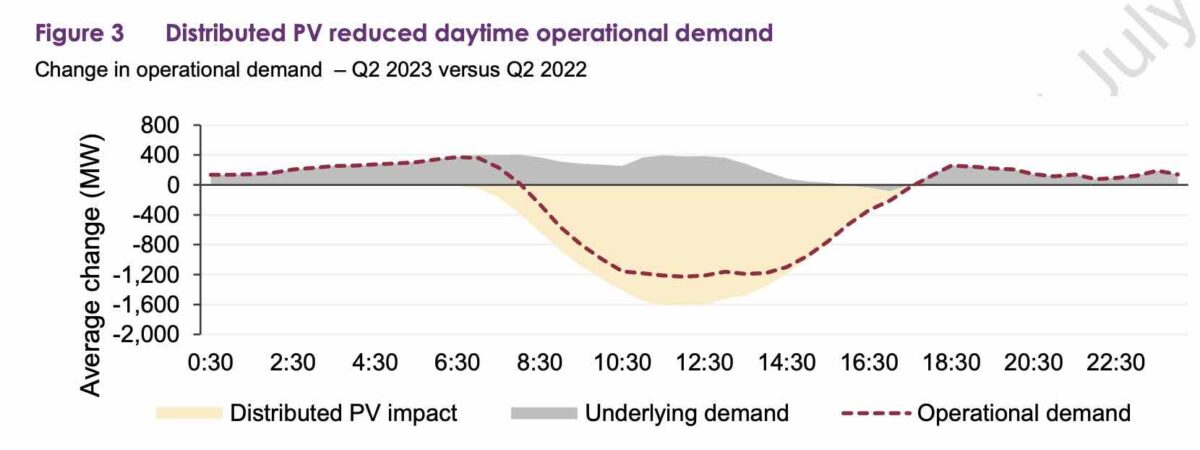
The effect of this increase in rooftop solar PV and reduction in operational demand was to reduce the generation and push the pricing opportunities for the fossil fuel industry into the margins of the early morning and evening peaks.
More coal fired power was available in the quarter, despite the closure of the ageing Liddell coal generator in NSW in April, but less coal power was actually dispatched, largely due to the growing impact of rooftop solar. Expensive fossil gas was also priced out of the market, falling to its lowest average generation level since 2006.
This is significant. In the past, consumers have had no ability to respond to the market behaviour and pricing power of the fossil fuel industry and legacy utilities.
But now they do, and there is also -finally – an increased focus on how these technologies can help low income households and others unable to access solar. That household power has had the biggest impact on the coal industry, but electrification will also have a huge impact on fossil gas.

This graph above illustrates the growing share, and influence, of rooftop PV. That gap between operational demand (purple dots) and underlying demand (blue dots) is significant, and growing sharply since it first became a “thing” nearly a decade ago.
And as the legacy utilities lose market share to their own customers, it raises questions about their ability to grow their business in line with the accelerating transition to green energy.
It may also explain why the federal Coalition is now targeting rooftop PV and solar inverters in a new scare campaign that paints them as a threat to national security. It is just the latest part of its decades-long to slow down renewables and protect the coal and gas industries.

AEMO’e head of reform delivery, Violette Mouchaileh, said in a statement accompanying the report that the combination of less volatile market conditions, improved generation availability and higher renewable output put downward pressure on wholesale electricity prices in the last quarter.
“Increased market share of lower marginal-cost renewables helped push down the wholesale electricity cost from Q2 2022, despite this quarter having the highest Q2 underlying demand recorded since 2016,” Mouchaileh said.
“Rooftop solar generation increased 30% from Q2 2022, which reduced electricity demand from the grid. Coupled with higher renewable output, wholesale prices were zero or negative 9% of the quarter throughout the NEM, a new Q2 record,” she said.
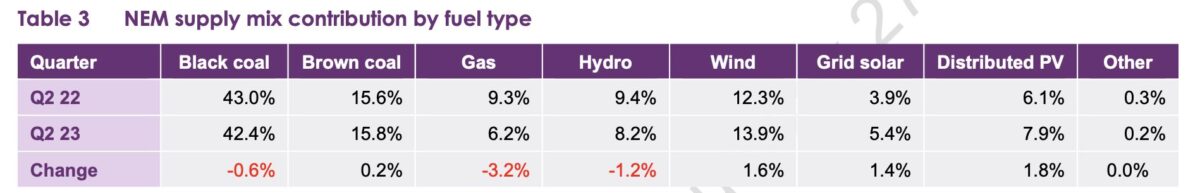
AEMO said generation of renewables rose – rooftop solar by 1.8%, wind (1.6%) and grid-scale solar (1.4%) compared to Q2 2022. But gas (-3.2%), hydro (-1.2%) and black coal (-0.6%) all decreased.
The number of negative pricing events also increased, particularly in the states with the most wind and solar. South Australia experienced negative prices on 17 per cent of pricing intervals, and Victoria 13 per cent.
Rooftop solar was a major influence, with negative prices occurring more often between 9am and 5pm, with 29 per cent of pricing intervals between 9am and 5pm going negative in South Australia, followed by 25 per cent in Queensland, and 20 per cent in Victoria.
NSW suffered the highest wholesale prices during the last quarter, as transmission bottlenecks from other state grids and the state’s relatively low wind and solar share reduced competition, and allowed incumbent generators to profit from the closure of Liddell.
Prices averaged $137/MWh over the quarter, despite the actual cost of fossil fuels falling in the quarter.
However, the QED report reveals how – given the opportunity – the fossil fuel industry remains completely shameless in the exploitation of the markets, and consumers.
South Australia suffered a big jump in average prices over the quarter, despite the increasing number of negative pricing events mentioned above. But the main reason for the increase in average prices was the lack of transmission capacity with neighbouring Victoria because of repairs and maintenance.
Nearly one fifth of this increase in average wholesale prices came from a single event, just three hours long, on May 4, when the gas generators took advantage of low wind output and a 50MW import limit on the main inter-connector from Victoria, to push wholesale prices up to the price cap of $15,500/MWh.
Of course, this had nothing to do with the increased cost of gas generation – expensive as it is. It is simply the exercise, or some would say abuse, of market power.
The pricing party was ended when household rooftop solar came to the rescue as the sun rose, but those prices will still find their way into consumer bills. Similar events of pricing power occurred in NSW, Victoria and Queensland, all due to the reduction in competition caused by transmission line repairs.
The Australian Energy Regulator is required to report on such events, but is painfully slow in doing so. It has only just reported on high pricing events (above $5,000) – again all caused by limited transmission – that occurred between January and March.
Over the quarter, the share of renewables grew to 35.4 per cent, and the share of wind and solar to 27.2 per cent, a rise of almost five per cent from the same quarter a year earlier.
This meant that total emissions on the NEM declined to the lowest Q2 levels on record at 28.7 million tonnes of carbon dioxide. The emission levels was 6.6% lower than the same quarter in 2022. The grid’s emissions intensity also dropped 4.3% to 0.61 tCO2-e/MWh.