At a macro level, the energy transition will be filled with many large challenges to be solved. There are plenty of smaller, unexpected, and fascinating ones as well.
I first heard of the ‘Russ Christ Effect’ (so named after its discoverer) during a presentation from Powerlink CEO Paul Simshauser last year. I was fascinated by the concept at the time, and this Saturday just past (December 16) I realised I was witnessing it unfold.
The theory goes like this. On summer days, Brisbane often sees heat and humidity build slowly across the day to fairly disgusting levels by the afternoon.
This results in air conditioners all around the region running hard to cool and dry air for their occupants. On a sunny day (like Saturday) this is largely being offset by rooftop PV (as it was in my own household).
By late afternoon, storms can rapidly build in the west and head towards the city. As the sun is also, by this point, starting to set towards the west, these storm clouds cause the skies over Brisbane to rapidly darken and rooftop PV production falls of a cliff.
The catch is that this ‘darkening’ often occurs before the cool change associated with the storm hits the city. The result is rooftop PV generation dropping sharply while underlying household demand stays the same or keeps climbing higher.
Operational demand though – what is seen by the network after deducting off rooftop PV and what needs to be supplied by generators – rockets up sharply and somewhat unexpectedly, having ripple effects through the system.
This played out in a textbook fashion on Saturday 16 December 2023, albeit somewhat rarely in the early afternoon around 2pm. The figures below are based on data from my home weather station (in inner east Brisbane) as well as AEMO data.
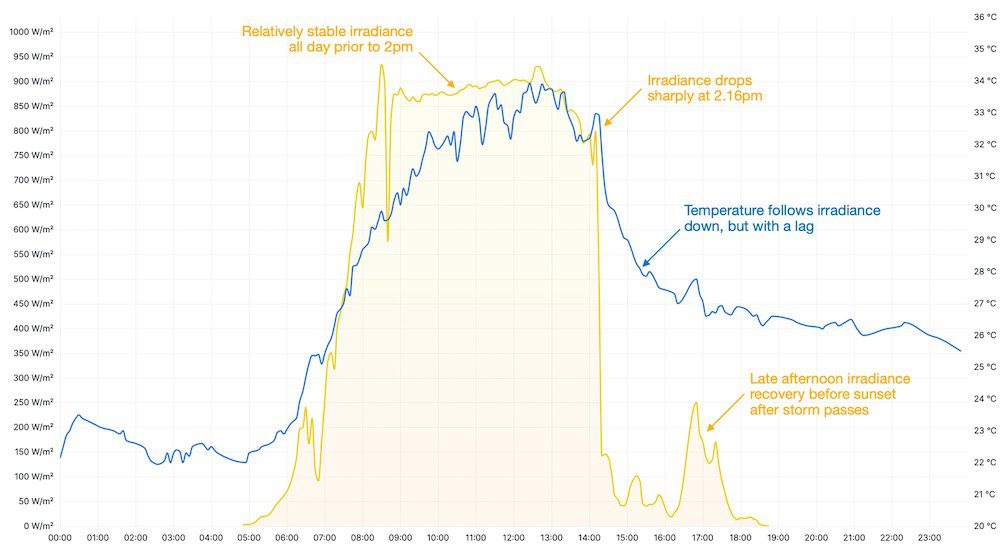
Figure 1 shows solar irradiance (yellow line) vs. ambient temperature (blue line) at my home across the 24 hour period of the day. The point in time when the brewing storm suddenly blocked out the sun can be seen clearly just after 2.15pm.
Figure 2 zooms in on the period 1pm to 4pm to more closely observe what is happening at a one minute resolution. Solar irradiance (as a proxy for rooftop PV generation) falls sharply from 800 W/m2 at 2.16pm to less than 150 W/m2 at 2.20pm. For my 5 kW system, this meant a drop from 3.71 kW of output to 600 W of output (down 85% in less than 5 minutes).
The blue temperature line does also start falling around this time, but lags behind noticeably. At 2.15pm it is reading 33.2 degrees. At 2.20pm it is still reading 32.0 degrees. It is not until after 2.30pm, more than 15 minutes after PV production has dropped, that it falls under 30 degrees and a reprieve to the hot and humid conditions can start to be felt.
(Side Note #1: the ‘cooling’ effect appears to have been less pronounced at my house than surrounding areas of Brisbane as the main band of rain missed. From a casual glance at other weather stations, temperatures dropped even more sharply in other areas around the same time).
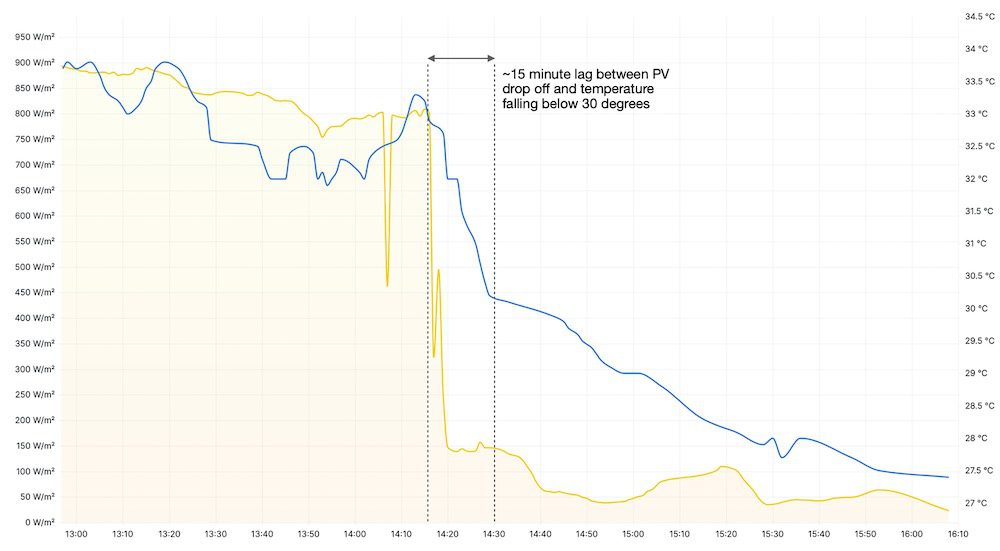
Figure 3 is where the impact of this far beyond my rooftop can be observed. Using the Forecast Convergence feature of the ez2view software package, it can clearly be seen that the AEMO pre-dispatch consensus for the 2pm to 3pm period was expecting demand to be much lower than what it tuned out to be (solid black line).
Even immediately beforehand, demand was forecast to be between 7,300 – 7,800 MW (and predictions earlier in the day were <7,000 MW). In reality, demand ended up rocketing vertically past this and instead hit 8,581 MW for the half hour ending at 15:00.
(Side note #2: this graph also shows how the arrival of the afternoon storm and cooler temps drastically reduced the evening peak vs. earlier forecasts).
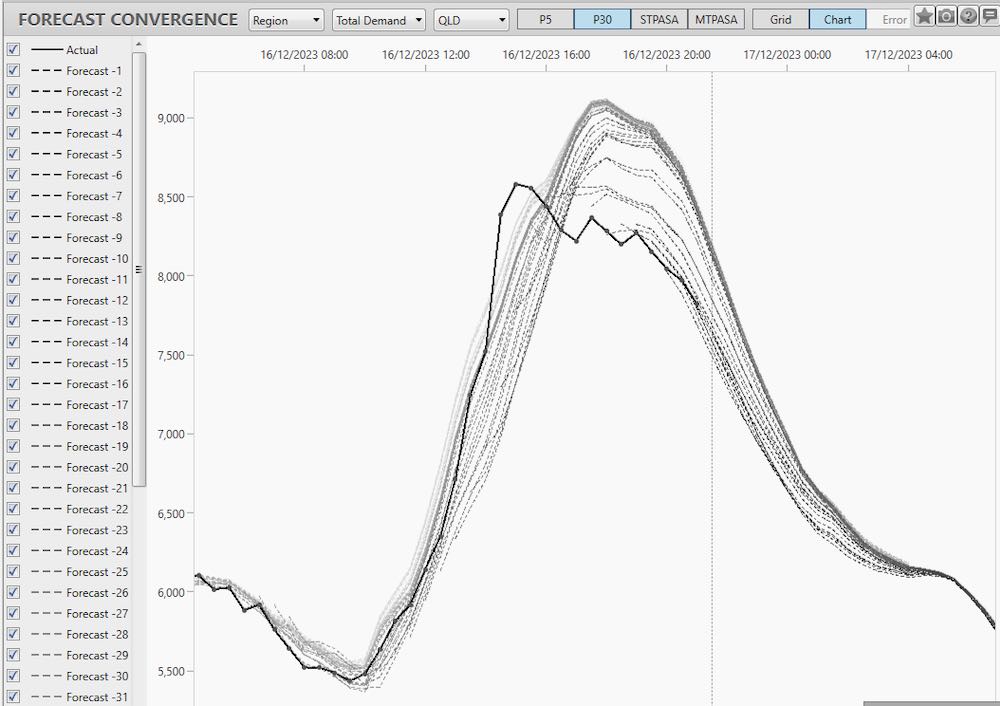
Looking at the 5 minute data, actual demand at 1.55pm (the trading interval ending 14:00) was around 7,550 MW. By 2.30pm (35 minutes later), demand was now 8,480 MW – an average ramp rate of 132 MW per trading interval, and max rate of 213 MW between 2pm to 2.05pm. What’s most notable is that this rapid uptick in demand occurred early in the afternoon on a weekend. It’s fair to say that racing up the merit order almost 1,000 MW in half an hour is not typically expected at this time of day. It also raises interesting questions about this occurring when demand was sitting at a higher starting point.
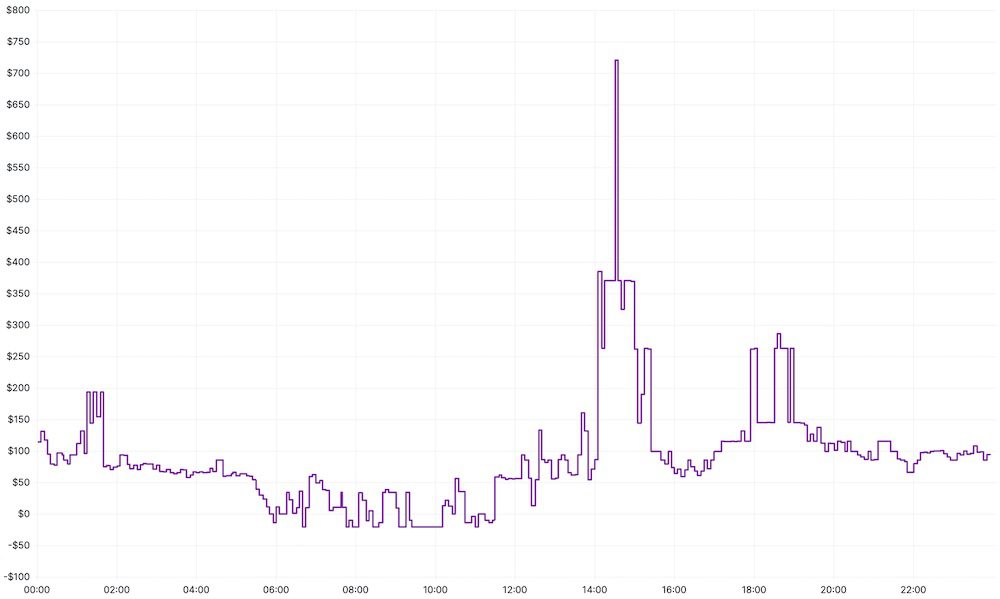
The result of this was a sudden increase in pricing in the QLD region from around 2pm as seen in Figure 4. (Noting that the timing in the weather data is for my house – this effect will have hit different parts of Brisbane at slightly different times).
Prices jumped from $85/MWh at 14:00 to $385/MWh five minutes later (during that 213 MW single interval ramp). By 14:30, prices had spiked as high as $730/MWh. Prices then remained elevated for a further hour or so, with even high merit order peaking plants likely Oakey firing up to help manage a suddenly volatile situation. At the micro level, I was also able to take advantage of a quick arbitrage opportunity with my home battery from 14:30 – 15:00 at an average price of $453/MWh.
This event provides a fascinating case study of how an energy system that is increasingly linked to the weather can throw up surprises on varying and unexpected time horizons. This highlights the increasing value of flexible and fast ramping generation plant and demand response, and should provide food for thought for all market participants. For Brisbane residents, keep an eye out during the next afternoon storm and see if you can spot the Russ Christ effect in action for yourself!
(Side note #3: when looking at the data for this I realised that this effect had also sort of played out in the weather data the day before (Friday 15 December). The effect of this was much more subdued in the market though because a) it had been cloudy all day in Brisbane and hence rooftop PV output was already flaky, and b) it occurred around 4.30pm so the market was already commencing ‘evening ramp up mode’ in a way that it isn’t typically at 2pm on a Saturday.)
Andrew Wilson is the Future Energy Development Lead at CS Energy. He and his team are responsible for helping deliver the transition of CS Energy’s portfolio through the development of new publicly owned renewable and firming assets.
The views expressed in this article are his own. To read the original article on LinkedIn, click here.