Gas and coal have lost market share to renewables this year and when compared to the previous corresponding period in 2022.
Wind and solar – collectively known as variable renewable energy (VRE) – are up 4% to a 28% share of generation on Australia’s main grid, even as solar output is now well into seasonal decline.
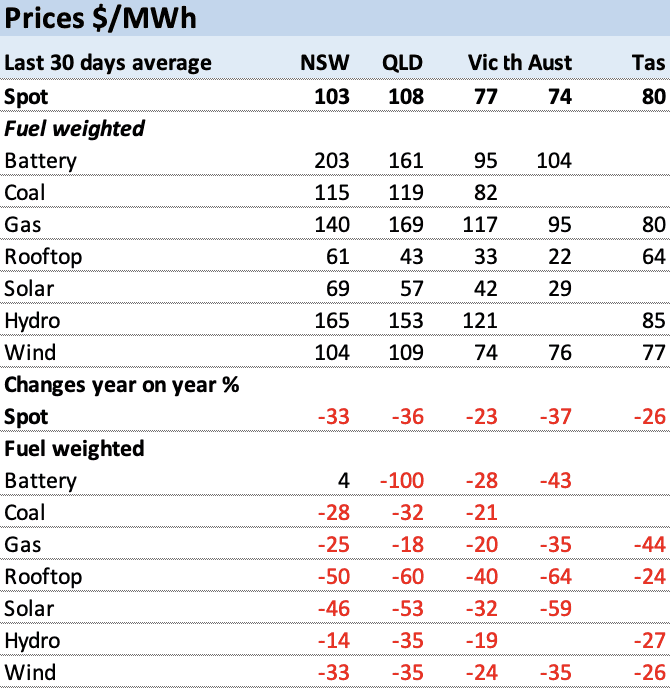
This table below shows the average prices over the last 30 days by state, while the second table shows the average volumes, also by state.
Prices are falling
I’ve been slowly moving my National Electricity Market (NEM) review analysis of data, mostly sourced from the irreplaceable NEM Review from Excel to Python and Pandas, and this has provided both challenges and opportunities.
For one thing, there are the fuel weighted dispatch prices which I discussed recently but that process also requires some estimates of sales by fuel.
The dispatch weighted price is calculated by dividing revenue for some period by the volume for that period of a fuel. That contrasts with the time weighted price which is just the average pool price over some time interval whether it be 5 minutes or a year.

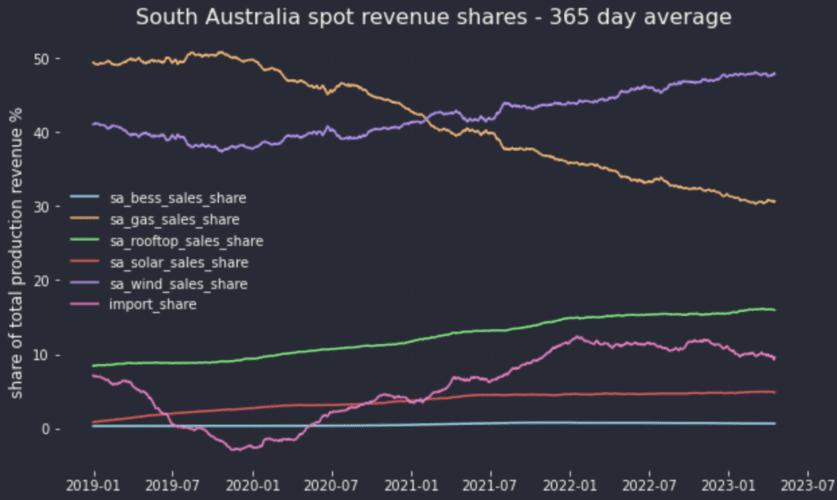
In most states in the NEM regions, coal continues to dominate the revenue pool but as usual it’s interesting to look at South Australia. This small market (average demand about 1600 MW) has no hydro and no coal. Firming is provided by gas and by imports.
Despite the increase in gas prices, gas has continued to lose sales market share in South Australia. This must mean, although I don’t prove it here, that gas is setting the price less often in South Australia than it used to.
And this undoubtedly, in my opinion, contributes to why South Australian prices, which generally used to be higher than other states, are now below NEM averages.
Equally, South Australia on a net basis is not importing that much power.
Typical of most markets utility solar has only a small share of sales revenue.
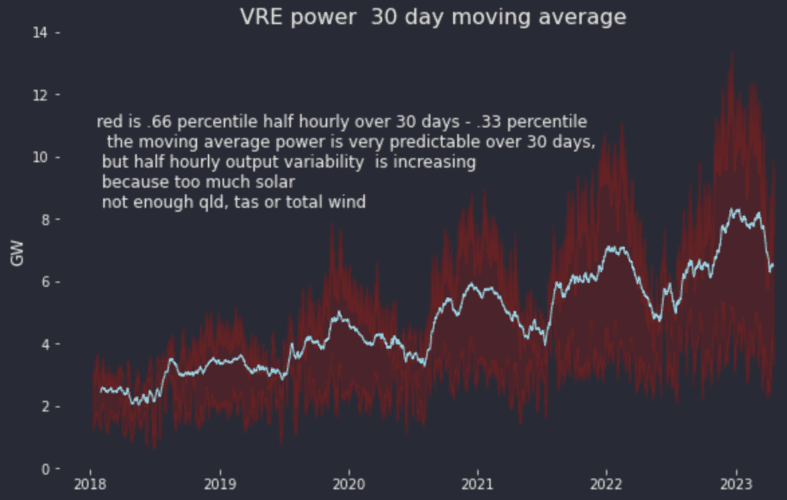
Overall, VRE power drops about 2 gigawatts (GW) in the middle of the year compared to its December peak.
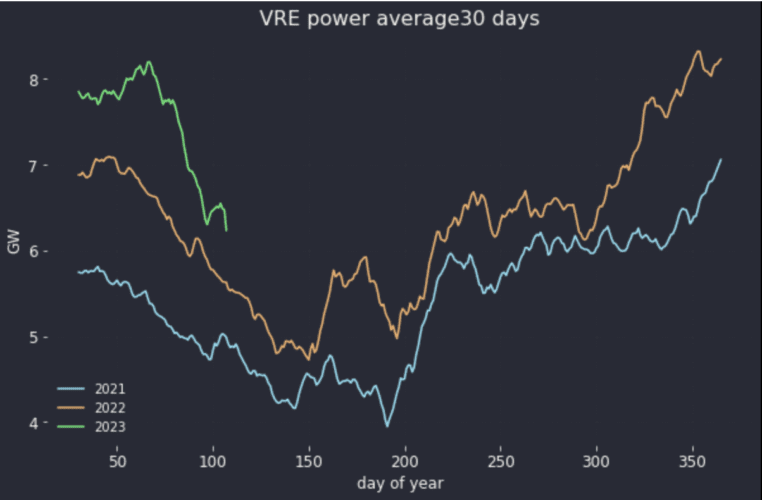
And the volatility and seasonality in absolute terms are increasing even as the VRE market share increases and with it the predictability of the average output over a month.
Although wind output is increasing, rooftop solar is increasing even faster and exceeded wind in December/January on average.

As good and wonderful as it is to see rooftop increasing at this rate, and there is little doubt 2023 will be a banner year, the increase shows that wind output isn’t growing at the same rate.
Seasonality’s impact on price is not yet clear
Long ago we found out that it’s more difficult to hit a moving target than a stationary one. VRE is itself always changing, making conclusions drawn from the past perpetually suspect. But the rationing prices that were a feature of last year makes the price data relatively useless.
To start with, we can contrast VRE output in May and June of 2022 (more or less the worst 60 days) with November and December, the best 60 days.
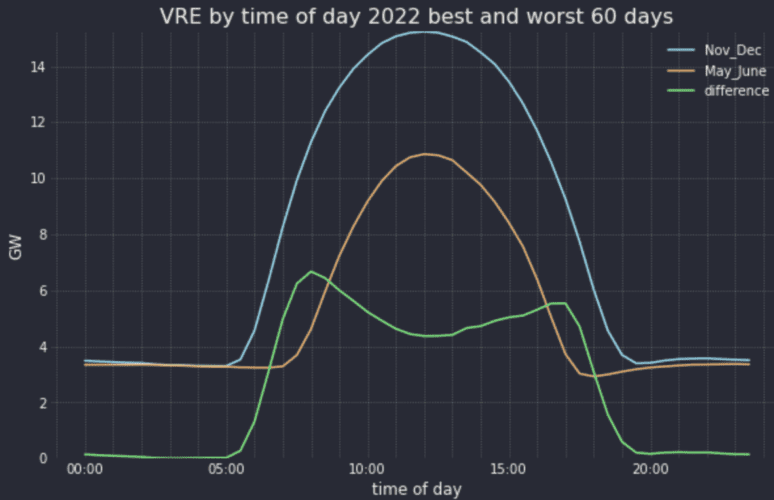
The first point is that until there is a lot more wind in the system seasonality is irrelevant between 8 pm and 5 am. There is no difference to speak of in overnight output.
To a significant but still first approximation, we don’t care that much about the 4-6 GW decline in the 10:00 am to 3:00 pm window because that’s when there tends to be an excess of generation and prices are low.
That leaves the morning and afternoon peaks, our traditional intra day target market for 4 hour batteries and 8 hour pumped hydro or worst of all gas.
After being tortured relentlessly, the Victorian price data gives up a few snippets. The following chart shows the “normalised” median price for each half hour year by year. So normalised is the median for half hour divided by the average of the medians for all the half hours in the day.
This enables us to compare one year with another subject to various limitations. Using medians smoothes out some price excesses, but not year long excesses. Even so we can see that the price duck curve overall has become far more pronounced as Victoria’s VRE penetration, now about 30 per cent, has increased:
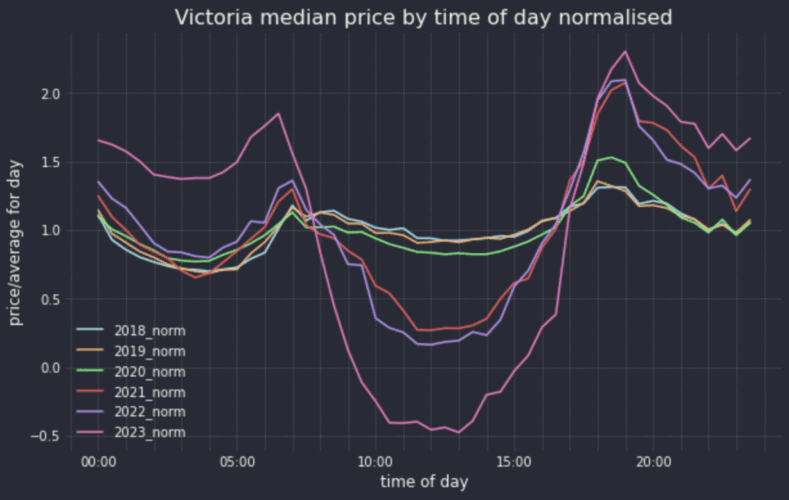
The 2023 data is of course only for three months but even so it seems that we have clearly moved beyond what was happening in 2018-2020. So to look at seasonality I selected 2021 and 2022 as the average years.
The following figure doesn’t explicitly break out the seasonality, but it displays the obvious point that as things stand the lower the VRE production for a day during 2021 and 2022 in Victoria, then the higher the Victorian price.
Equally the correlation is far from perfect (correlation coefficent roughly 50 per cent) so it’s a driver but not the only one.

I guess this was a lot of work to end up with a very obvious conclusion. At this rate I’ll soon be a qualified consultant, or maybe academic.