My recent updated modelling of renewable energy (RE) capacity, gas use and ramping in the transition of Western Australia’s main grid, the South West Interconnected System (SWIS), to 100% RE, is presented here.
The modelling reveals the need to greatly increase installation rates of wind generation and transmission on the SWIS is order to achieve the mandated target of 82% RE by 2030.
Three electricity generation realities ignored by the Coalition in the lead up to the 2025 federal election, along with other popular opposition myths around electricity bills are discussed in the light of the modelling.
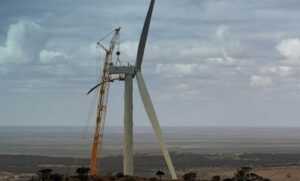
Wind and transmission are not being installed fast enough on the SWIS
Table 1 below indicates that to achieve its mandated aim of 82% renewable electricity by 2030, the WA Government has less than 6 years to install:
– 3000 – 3300 kW of new wind;
– 600 – 700 kW of new utility PV;
– 1500 MWh of new storage;
– at least 250 km of new transmission lines.
Table 1. Renewable energy capacity for a modelled 9 step transition to 100% renewable energy on the SWIS, with doubling of demand.
| Modelled RE capacity | ||||||
| Transition stage | LCOE | Demand % of 2025 | Wind (MW) | Rooftop PV (MW) | Utility PV (MW) | Battery Storage (MWh) |
| 2025 Muja C already closed, 35% RE | $105 | 100% | 1200 | 2200 | 140 | 6,000 |
| 2026, 44% RE | $110 | 105% | 2100 | 2400 | 140 | 6,400 |
| 2027 Collie closed 53% RE | $106 | 109% | 2400 | 2700 | 140 | 6,400 |
| 2028 one CCGT unit closed 62% RE | $107 | 114% | 3000 | 3100 | 200 | 6,400 |
| 2029 Muja D closed 72% RE | $111 | 120% | 4000 | 3500 | 600 | 7,200 |
| 2030 Blue Waters closed NO COAL 82% RE | $105 | 125% | 4500 | 3900 | 600 | 7,500 |
| 2033, 90% RE | $107 | 143% | 5800 | 5200 | 700 | 14,400 |
| 2037, 95% RE | $122 | 172% | 8000 | 6800 | 1000 | 21,600 |
| 2041, biofueled OCGT, 100% RE | $139 | 205% | 10000 | 8500 | 2100 | 52,800 |
The modelling finds that cost efficiency is optimised by keeping wind capacity equal to or slightly less than PV.
The PV requirement is not a major concern as it is quick to install and could be achieved by building a few solar PV farms, though none have been announced. Alternatively, the rate of installation of rooftop PV could be increased.
Installation of batteries is proceeding apace and is already close to being sufficient for 82% RE.
However, installation of transmission and wind generation must be dramatically increased.
The necessary new transmission lines to planned wind generation zones in the south east and or offshore of Bunbury have not even been announced, though they are vaguely mentioned in a planning document.
Although there are many wind projects ‘in the pipeline’, few if any have final planning approval. For example, there are proposals for large wind farms at Ongerup and Wagin, but the transmission for them does not yet exist.
In summary, the installation of new transmission and wind needs to be accelerated in order to:
– Achieve the WA Government mandated 82% RE by 2030;
– Achieve CO2 emissions reduction of 5.2 million tons per year;
– Prevent the steam thermal ramping / reliability issues described in 1/ below.
Three electricity generation realities ignored by the Coalition
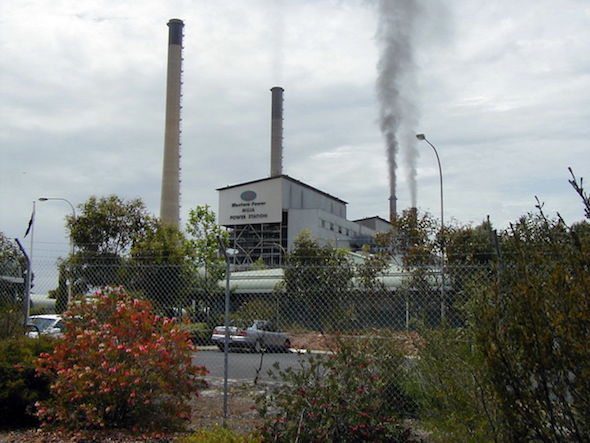
- Costly cycling of steam thermal units increases until all large scale ST is closed
The financial costs associated with cycling (ramping and stop/starting) of coal fired units is well documented.
Table 2 shows that on the SWIS, steam thermal (ST) is required to either ramp to more than 50% of ST capacity, or stop/ start and/or or pay to waste RE three times more frequently at 54% RE and more than treble that again as RE increases, until all large coal and combined cycle gas (CCGT) steam thermal is closed.
Note: From 65 – 200 MW of small (30 MW) waste to energy plants remain after all fossil ST is closed. These small units are easier and faster to stop and start than the existing large unit, which are 10 times the capacity.
The WA Government’s plan apparently recognizes the ramping issue and has all coal closed at 82% RE. It has learned a costly lesson by wasting $310 million refurbishing the old Muja A-B units, which were closed after a few years running at less than 20% capacity.
It is not clear what is planned for the CCGT combined heat and power gas turbines located at three alumina refineries.
The cost of cycling applies to the NEM even more than the SWIS as there are many more and larger coal generators. For example in the last 3 years Callide B and C in Qld have had 3 major forced outages, each resulting in one of the 700 – 800 MW units going off-line for 3 to 18 months, plus several shorter outages and a prolonged maintenance outage. Despite this, the recently elected Qld Liberal National Party government recently decided to keep them running a least 3 years longer.
If elected the Federal Coalition wants to keep many coal plants going for up to 20 years while limiting RE to 54%, a level where either more frequent and costly cycling or wastage of RE will be inevitable. This will prolong and worsen the reliability problems and increase maintenance costs of the old coal generators and increase wholesale energy prices.
The sensible thing to do is to install adequate storage capacity to mitigate the impact of ramping and stop / start on coal plants, while rapidly building sufficient RE to replace coal generation immediately as each coal unit is closed.
This is exactly what the federal Labor government is funding under the current NEM transition strategy. It is what the SA and Tasmania governments have already successfully achieved and the NSW, Victoria and WA governments are in the process of doing.
If the Coalition wins government, it will be interesting to see if the Labor state governments will tolerate their costly coal-nuclear strategy.
Table 2. Frequency of deep steam thermal ramps during the SWIS transition to 100% RE
| Transition stage | Total steam thermal (ST) capacity (MW) | Number of system ramps >50% of ST capacity per hour | Type of ST power |
| 2025 Muja C closed, 35% RE | 1,886 | 19 | Coal + CCGT |
| 2026, 44% RE | 1,886 | 32 | Coal + CCGT |
| 2027 Collie closed 53% RE | 1,651 | 53 | Coal + CCGT |
| 2028 one CCGT unit closed 62% RE | 1,337 | 92 | Coal + CCGT |
| 2029 Muja D closed 72% RE | 1,130 | 136 | CCGT + COAL + small waste to energy |
| 2030 Blue Waters closed NO COAL 82% RE | 695 | 176 | CCGT + small waste to energy |
| 2033, 90% RE | 100 | 342 | Small waste to energy plants |
| 2037, 95% RE | 150 | 323 | Small waste to energy plants |
| Bio-fuel, 2041, 100% RE | 200 | 315 | Small waste to energy plants |
No new gas is needed for the transition to 100% renewable electricity in Australia
- It must be noted that the percentage of gas generation on the SWIS (38%) is far higher than on the NEM (5%) and the SWIS is an isolated grid with no hydro. However, points 1 -3 will likely also apply to the NEM.
The SWIS modelling shown in Figure 1 shows that:
– There is no significant increase in gas use on the SWIS during the transition from 35% RE (2025) to 100% RE.
– Ninety per cent RE, which in my view is the ‘sweet compromise’ of low cost and low emissions could be achieved by 2033 if there is sufficient political will. Gas use on the SWIS is halved at 90% RE even though demand is estimated to be 75% higher.
– Although gas use ticks up slightly after the closure of the remaining steam thermal plants, it quickly goes down as more RE is installed.
– WA domestic gas reservation policy reserves 15% of offshore gas production and 80% of onshore gas for domestic use, ensuring gas prices are kept relatively low. However, prices have increased since the State Government did a sweetheart deal enabling their friends with onshore gas fields to export 20% of their previously reserved production. WA domestic gas prices are currently $7 – 8 per GJ. My SWIS modelling assumes $7.50 / kg, though Synergy pays significantly less than that in long term contracts. Although this minimizes the economic incentive to reduce gas use, it sequesters adequate gas from existing fields to adequately cover the State’s electricity transition and industrial needs.
– East coast retailer gas supply prices are about $14.50/ GJ. There is no domestic reservation, but exporters have agreed to ensure the needs of the domestic market are met before they export gas that is uncontracted. Prior to this agreement, prices were volatile; up to double present levels in 2022. However, this has never reflected scarcity as 70% of east coast gas production is exported as LNG.
– At 100% RE, OCGT generation on the SWIS will likely be fuelled by liquid biofuel or renewable hydrogen based fuels. OCGT fuel energy use falls to 20% of current levels, though demand is modelled as 205% of current levels.
The six points above destroy the myth propagated by Woodside, the other gas producers and both major political parties that Australia needs to develop more gas fields to enable its clean energy transition!

The only realistic way to calculate cost of electricity generation is Levelised Cost of Energy (LCOE)
LCOE = total capital and operating costs of generation / MWh of energy generated.
LCOE is expressed as $/MWh. As can be seen in Table 1, it is not dependent on the amount of electricity generated.
LCOE is modelled here with SIREN and PowerBalance2 software using hourly wind, solar, and demand data for 2014, a low wind year. Generation and demand data are scaled for 9 grid scenario steps.
Peter Dutton and shadow ministers O’Brien, Taylor and McDonald must understand LCOE. If they do not, then they are not qualified to hold their positions. Nevertheless, the report they commissioned from Frontier Economics does not even mention LCOE, let alone model it for nuclear and RE scenarios.
Instead, they appear to have modelled the total cost to supply about 75% of the energy demand forecast in the AEMO base case “Step Change” scenario, because they will make sure there are less EV’s! Then they used a nuclear capex of half that stated in the CSIRO GenCost Report, 2024. Hey presto, the cost of supplying the lesser amount of energy, when including nuclear at half cost, is 44% less than the AEMO base case for renewable energy!
They are hoping that enough voters will be taken in by their bogus modelling exercise, but recent polling indicates that many are already seeing through this blatant deception.
In summary, the Coalition is displaying wilful ignorance and using blatant lies to justify curtailing the installation of RE. They intend to cap RE at 54%, incurring high risk of blackouts caused by keeping old coal plants running for up to 20 years, although many are already near the end of their design life.
Then they intend to build nuclear power plants to replace the old coal, increasing the cost of energy by at least 30% and imposing huge insurance and waste disposal costs on future taxpayers.
Electricity bill nonsense
Opposition politicians often claim that the transition to 82% renewable energy has and will continue to cause ‘electricity bills to keep going up’. In fact, residential electricity prices did double in the period 2009 – 2020 in all eastern states, mainly due to privatization of grid, generation and retailer assets, but have since come down by about 15% in 4 years of accelerating installation of RE.
Average residential electricity prices are forecast to decrease by up to 5 c/kWh by 2034 (Table 3), coinciding with the RE Transition. However, Coalition politicians like to perpetrate the myth that electricity bills are still increasing as they did in the decade to 2020.
Table 3. Components of residential electricity bills
| 2025 c/kWh | 2025 percent | 2030 c/kWh | 2030 percent | 2034 c/kWh | 2034 percent | |
| Wholesale energy generation costs | 11.5 | 33.1% | 6 | 20.9% | 10.1 | 33.7% |
| Distribution | 11.3 | 32.6% | 11 | 38.3% | 9.4 | 31.3% |
| Transmission | 2.6 | 7.5% | 3 | 10.5% | 2.9 | 9.7% |
| Other network costs | 0.5 | 1.4% | 1.2 | 4.2% | 0.5 | 1.7% |
| Retail | 5 | 14.4% | 4.8 | 16.7% | 5 | 16.7% |
| RE schemes | 2.2 | 6.3% | 1.2 | 4.2% | 0.7 | 2.3% |
| Metering | 1.6 | 4.6% | 1.5 | 5.2% | 1.4 | 4.7% |
| TOTAL | 34.7 | 100.0% | 28.7 | 100.0% | 30 | 100.0% |
Another common energy deception is to conflate residential electricity price with wholesale energy generation cost, which in fact comprises only 21 – 31% of residential energy bills (Table 3).
Note: Wholesale energy generation cost is approximately equivalent to LCOE.
To put this in perspective, my modelling summarized in Table 1 indicates that 82% RE on the SWIS grid will likely incur no increase in the wholesale energy cost (and thus electricity bills) and 90 % RE will likely increase it by about 0.2 c/ kWh.
Note: $10/MWh = 1c/ kWh.
Distribution – the poles and wires that distribute energy to houses and businesses – comprises another 31- 38% of residential bills. Along with retail and fuel costs, ‘gold plating’ of distribution networks has been a major cause of electricity cost increases.
Market rorting when gas and coal prices spiked due to the Ukraine war was a temporary cause of energy bill increases on the NEM, but this is generally ignored by the Opposition.
Note: Fuel price spikes had little or no impact on the retail residential electricity price in WA, where there is a domestic gas reservation policy and the Government owned retailer sets residential bill prices
Transmission – the large pylons carrying high voltage energy large distances from the generators to the suburbs and industrial hubs – barely exceeds 10% of bill costs (Table 3), even when there is major construction of additional transmission to renewable energy zones in 2030 – 2034.
To put this in perspective, the amortized cost of the additional 300 km of transmission infrastructure required to connect the new wind energy hubs needed to attain 82% RE on the SWIS will likely add less than 0.4c/ kWh to electricity bills.
Flying in the face of these facts, opposition spokespeople have conflated transmission with distribution, claiming that transmission comprises 40% of bills. Dutton says ‘bills will keep going up because of the cost of putting out 28,000 kilometres of new transmission lines……’ but of course, fails to say by how much. In fact, Table 3 indicates that bills will actually go down.
O’Brien and Dutton also claim that “Labor is quietly imposing a carbon price by stealth – a ‘Value of Emissions Reduction’ charge …… that will be borne by Australians.”
In fact it is not a carbon tax or charge of any sort but a ‘value of emissions reduction’ guidance for network businesses to use in in investment proposals.
The other popular false claim by opposition spokespeople is the ‘huge cost of RE subsidies’, which in fact account for only 2 – 4% of electricity bills (< 2c/ kWh), and will fall to less than 1c/ kWh, (Table 3), as the Renewable Energy Target scheme scales down.
In summary, contrary to Opposition claims, renewable energy is exerting downward pressure on residential electricity prices. Past price increases have been mainly due to privatisation, gold plating of distribution networks, gouging by some retailers and fuel price increases.
Energy policy articles, interviews and debates in the lead up to the 2025 Federal election have generally been poor, with much deception going unchallenged by the mainstream media.
Energy journalists in need to improve their energy literacy and knowledge, and interviewers covering energy issues need to be properly briefed by experts who have properly researched the topic.
Ben Rose is an energy and emissions analyst at Clean Energy Modelling