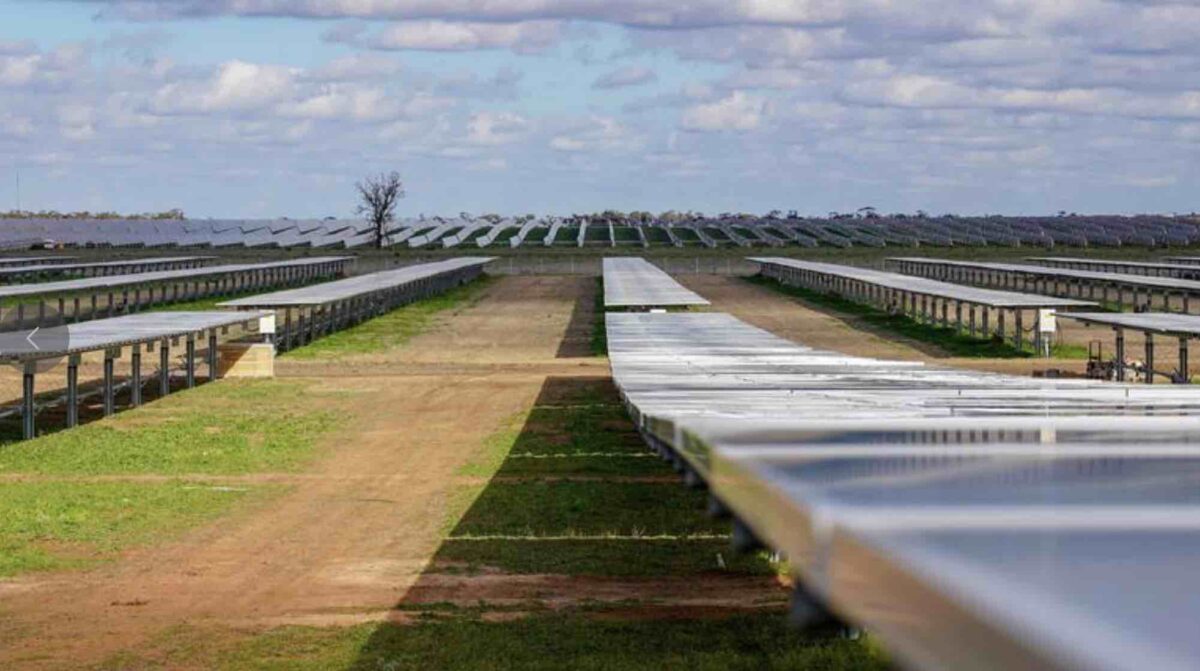
January has kicked off 2024 with another two solar records for Australia, including new all-time highs for utility solar generation set in New South Wales (778 GWh) and Queensland (648 GWh), according to the latest data from Rystad Energy.
For NSW, the bumper month is illustrated in the charts below, from Rystad’s David Dixon, with large-scale solar farms in the state taking up 13 spots in the ranks for top performing assets for January.
NSW PV projects dominate the top 15 spots, with the notable exception for the top spot – which went to the Greenough River solar farm in Western Australia, with a capacity factor (CF) of 41.6 per cent.
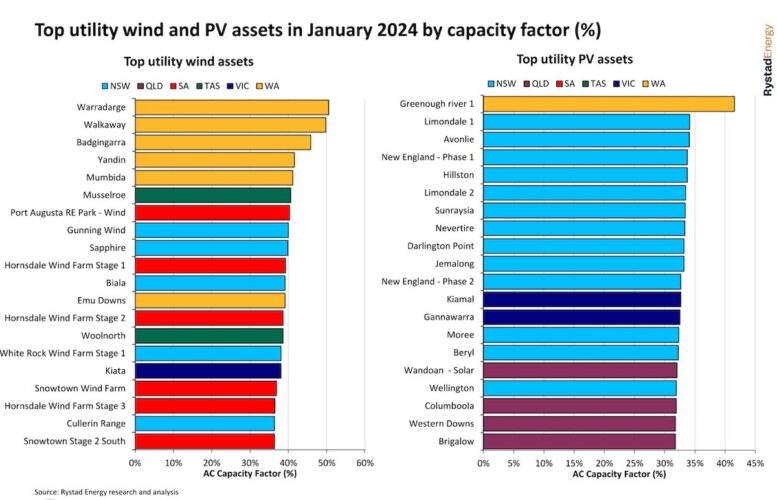
Interestingly, some of the solar farms in NSW with the highest capacity factors in January – such as Limondale 1 & 2 and Sunraysia – are also among the projects recently identified as facing significant changes to their marginal loss factors – grid ratings that which decide how much of a generator’s output is credited as “delivered.”
Across both solar and wind, Dixon says January 2024 ends with all Australian utility PV and wind assets generating 4,304GWh, up from 3,885GWh (+11%) in January 2023. And at a state level, NSW was in top spot generating 1,350 GWh with 775 GWh from utility PV and 575 GWh from wind.
Western Australia led the best-performing wind assets, with the top five assets located in that state, including the Warradarge wind farm (50.5% CF), Walkaway wind farm (49.7% CF) and the Badgingarra wind farm (45.9% CF). Tasmania’s Musselroe and Woolnorth projects also made the list, at numbers six and 14, respectively.