In this note I purport to show that a 6GW/8 hour battery is a superior choice to a 2 GW/24 hour pumped hydro station, albeit its life is shorter and its cost is a bit higher.
Batteries can provide much more firming than the pumped hydro system, they can provide all the system services Queensland will need and can likely support the transmission network rather than requiring billions of dollars of additional transmission. Of course, the transmission may be needed anyway.
The recently released information that Queensland’s Borumba pumped hydro station will cost $14 billion for 2GW of 24 hour storage = 48GWh is in my opinion a good reason for the Queensland to re-examine its options.
Batteries have a higher capital cost than pumped hydro although the difference based on Borumba is so much less than we are used to thinking. (See table at end of document.)
Also Pumped Hydro once built could be expected to last for 50 years or more. A battery, or as its called a BESS (battery energy storage system), typically has a life of 20 years based on a rated number of cycles per year.
That’s the end of the advantages of pumped hydro. The disadvantages include massive social license issues, long build times, a very low learning rate, cost blow out exposure, limited ability (compared to BESS) to provide system services (virtual inertia, black start) and typically lots of transmission.
However, the epiphany I had was that pumped hydro maximum power and configuration flexibility is non-existent. If you build a 2GW/24 hour pumped hydro station at best you can provide 2GW of power for 24 hours.
By contrast, a BESS with the same storage capacity as Borumba can be configured however you like. You could configure your 48GWh as 2GW by 24 hours, 4GW of 12 hours, 8GW of six hours and so on.
Let’s say your BESS was configured as 6GW of eight-hour storage. That’s the same energy (48GWh) as Borumba. You can run that as 6GW operating as eight hours or you can run 2GW for eight hours then the next 2GW then the final 2GW.
You get 2GW/24 hour just the same as the pumped hydro. But now you can take advantage of all the opportunities when you need more than 2GW but only for a few hours.
Confirming the obvious with a model
Due to previous work it was easy enough to set up in my very humble ITK model (not to be compared with space rockets like Plexos) a 2GW, 24-hour pumped hydro asset and also for comparison a 6GW eight-hour BESS.
The way these models work is purely mechanical. I start the storage asset at 80% full. For every half hour, if demand exceeds variable renewable energy (VRE), then the storage asset tries to fill the gap subject to its maximum power and also how much energy it has. If it doesn’t have enough energy then it supplies until it is empty.
The reverse is true if VRE supply exceeds demand. In that case the storage asset tries to store the excess subject to its power and its state of charge. Any excess supply left over is spilled and is recorded as a negative net firming demand.
Results show that the assets are regularly either empty or full because the Queensland needs more than 48GWh of storage and more than 6GW of firming power once it gets to 100% VRE supply around 2040 on the ISP view.
In this case both assets were assumed to have 75% round trip efficiency (even though BESS can achieve 85%)
In this exercise I only compared their peforrmance for the hypothetical FY 2045 in QLD. But the results could very easily be extended. Frankly ,I just got lazy.
Note my model uses ISP data, if Queensland builds its VRE at the energy and Jobs plan forecast pace it will get to 100% VRE around 2035. So while this note focuses on a notional FY45 it might as well by FY35 on the Queensland government timetable.
First of all I show the average day in FY45 for Queensland. The source data is basically from that provided by AEMO as part of the ISP 2022 documentation. All calculations and adjustments are of course my own.

As stated in the prior note, by 2045 some hydrogen demand is included and AEMO has carefully estimated electrification and EVs and changed the demand shape accordingly.
It’s important to understand that storage has to cope with wind and solar droughts as well as coping with the average day. Nevertheless, it’s interesting to look at the most common situation.
Basically I compared the performance of Borumba with a 6GW/8 hour BESS by looking at the residual need for firming after operating whichever storage asset I am modelling. Neither I nor anyone else is suggesting that Borumba alone can provide all the firming needed in a decarbonised Queensland electricity supply.
The following chart shows the residual demand for firming for both systems using median data. Medians don’t capture extremes (edge cases) but they still provide a useful view in my opinion.

On this measure we can see that the 6GW BESS comprehensively outperforms the 2GW pumped hydro asset. Using medians, 6GW of 8-hour storage means that no firming demand is needed in the evenings but using Borumba would still require another 3GW of firming power in the evening.
The BESS doesn’t perform quite as well in the morning, probably because it’s empty on lots of days, but even so, because it can recharge at 6GW instead of 2GW, it still does a better job than Borumba.
Consumers big and small don’t care about spilled energy, they only care about having enough power to run as they want to.
So for this next graph I only show results for when demand exceeded VRE. In this modelled year (FY45) that happened on 9867/17520 = 56% of half hours. The average demand over those half hours was 11.6GW and average VRE production 7.4GW.
The following chart shows a rolling 30 day sum (in GWh) of positive firming demand after operating our storage assets. That is, we ran the system with Borumba and then ran the system with the BESS. The assets operated over all half hours (ie recharged when supply exceeded demand) but the graph just shows how they performed when demand exceeds VRE supply.
Again, the result clearly favours the BESS. Typically the system with the 6GW BESS requires about 0.8TWh less additional firming per month relative to the system with the 2GW Borumba pumped hydro asset. “Net” means the difference between the Borumba and the BES results.

In FY45 in Queensland, February is the worst month
All of this analysis considers Queensland as an island. That is a bad way to do things. NSW and Queensland have very complementary wind systems and strong interconnects between the two states will greatly benefit both.
In another note I’ll show that result again. Nevertheless, considering Queensland as an island the greatest need for firming comes in February.

So looking at February 2045, half hour by half hour, the following figure shows the state of charge, in MWh, (maximum is 48,000 when the storage is full for both systems).
The chart shows that both systems are regularly at zero state of charge but that the extra power of the battery means it can recharge much more easily than the lower power Borumba asset and this is what enables it to easily outperform Borumba.

And to further illustrate, the following chart shows model output for Feb 21, 2045.
The day starts with the BESS or Borumba empty due to having been run flat the evening before. Neither asset was able to do anything until solar output went up.
After that, because there was enough sun, the BESS was able to achieve a much higher state of charge (SOC) and therefore could contribute more to evening demand. Note that the SOC lines are in MWh but other lines are MW. (Footnote: I can’t find a way to make the chart simpler.)
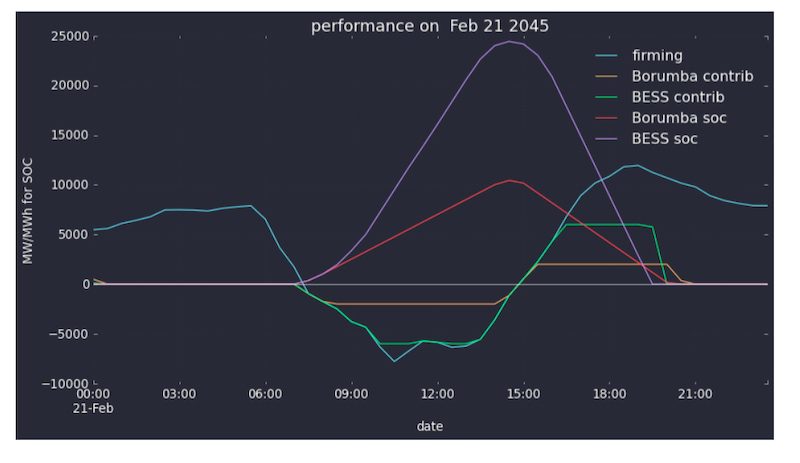
Figure 6 Comparing systems on a low VRE day. Source: ITK
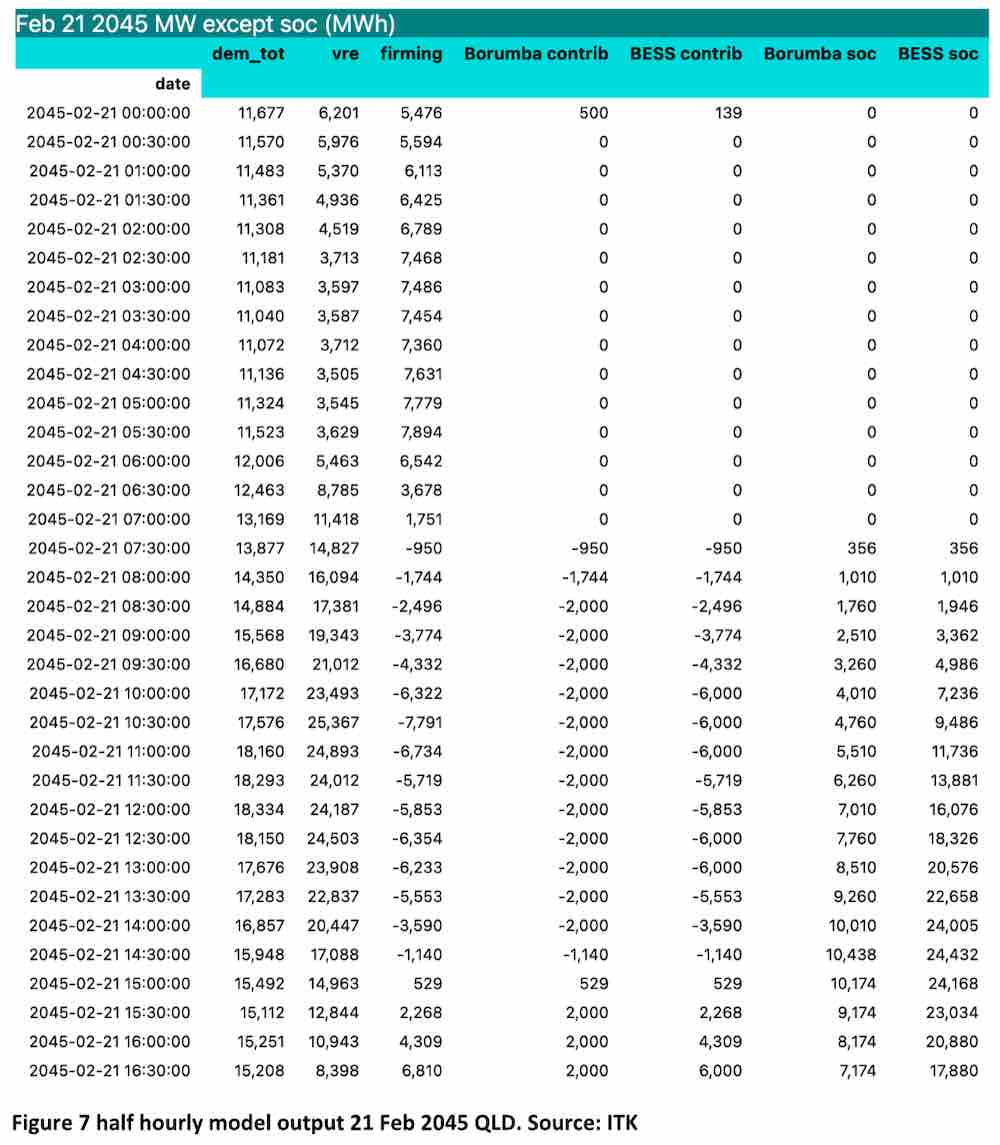
Finally, I show some of the actual numbers that were used in compiling Figure 6. Again, note that when the storage asset is charging it loses some of the energy to running the pumps or, in the BESS case, to other losses.
In table form a subset of the numbers shows:
Economics
As discussed the BESS will have a shorter life than pumped hydro and also likely higher maintenance cost but can be built far more quickly. The BESS can also provide additional revenues by managing the grid frequency.
The BESS can be located all along the existing grid, likely providing additional grid capacity but specifically it should avoid most, of if not all the transmission that Borumba requires.
In my last note I took a generous view of the $14 billion announced Borumba cost and assumed it included the associated transmission. Some more reading makes me now inclined to believe that Borumba is currently costed at $14 billion plus transmission. If that’s the case, the BESS gets within striking difference of Borumba
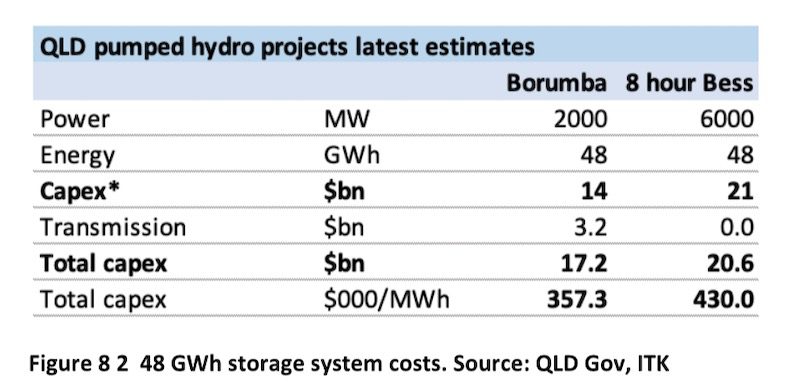
When you have chosen Borumba you will need at least another 2000MW of firming and probably another 4000MW to catch up with what the 6GW/8-hour BESS can do.
So all of a sudden I’m asking, why so keen on Borumba? It’s true my BESS numbers are a bit of a stretch, lots of assumed cost down, no transmission costs. Yet I still think if, it was me, I’d look again.