
Hydrogen In MWh In EU & Renewables In Btu In USA Distort Energy Transition Discussions
How we measure and report on the energy and decarbonization transition matters. The legacy of old units we use for energy distorts debate and discussion. Applying units of energy to things like hydrogen that aren’t energy frames them as necessarily part of the energy transition. And the USA’s habit of sticking with old Imperial measurements that no one else uses confuses things further.
But let’s start with hydrogen. What is hydrogen today? It’s an industrial feedstock and a climate change emissions problem, on the scale of all of aviation. Yet Europe measures it in units of electricity, TWh or MWh. What’s up with that?

Its biggest use is in oil refineries to remove sulfur, water, and other impurities from crude oil, and to crack lighter components out of heavier components. The worse the quality the crude oil, the more hydrogen is required, with my estimate being almost eight kilograms of hydrogen to process a barrel of Alberta’s oil sands crude, for example. Low sulfur, light crude uses a lot less. The difference is part of why Alberta’s (and Venezuela’s) crude oils will be first off the market as peak oil demand arrives later this decade, with shuttering of most oil sands likely by 2040. The roughly one-third of all hydrogen, 40 million tons, used for oil today will plummet in the coming decades.
Its next biggest use is in manufacturing ammonia fertilizer. About 25% or 30 million tons is used there. Fertilizer is essential to feeding the billions of people on the planet, regardless of impending peak population, most likely sometime between 2050 and 2070. We won’t eliminate fertilizer, but in my projections we’ll diminish its use substantially. Nitrogen fixing agrigenetics, precision agriculture, and low-tillage agriculture will all cut into demand for it.
The only growth sectors I foresee for it are in some pathways to the limited amount of biofuels we require for longer haul aviation and maritime shipping, and green steel manufacturing. Hydrotreating of biofuels is a identical to hydrotreating of crude oil today, but the big demand draws of desulfurization and hydrocracking won’t be present, so combined with much lower volumes of liquid fuels, it’s just not going to be a big consumption area. Green steel under the HYBRIT model uses 59 kilograms of hydrogen per ton of steel, but we’ll be turning more and more to scrapping existing steel, especially the massive amounts in fossil fuel infrastructure globally to supply new steel.
Note that none of these use cases is related to electricity and that I measure hydrogen in metric tons, an actually sensible unit for an industrial feedstock.
So why do especially European organizations insist on measuring hydrogen with units of energy? I recently stepped through a DNV report on manufacturing hydrogen offshore in wind farms. Among many other bad choices, it uses MWh as the measure of hydrogen.
It’s confusing. It takes about 60 MWh to manufacture a ton of hydrogen with the electrolyzer and balance of plant draws. But that ton of hydrogen isn’t equal to 60 MWh of electricity by any stretch of the imagination. First off, the 60 MWh used to manufacture, compress, store, and distribute hydrogen is perhaps 70% efficient. The 60 MWh is already only 42 MWh.
You can make a claim that hydrogen’s energy is equal to its heating value if burned, about 120 gigajoules (GJ). If you can get that hydrogen to something to burn it in without losses, you can get that much heat out of it. But hydrogen only turns into electricity through either the equivalent of a natural gas combined cycle generator that’s about 50% efficient, or perhaps a fuel cell that might be 60% efficient. In reality, only about half of the energy in the hydrogen is available as electricity.
The reported 60 MWh of hydrogen is only 20 MWh of real electricity. Using MWh for hydrogen as DNV does grossly distorts the meaning of the MWh unit.
As I noted in my assessment of DNV’s report, even with their incredibly optimistic numbers for green hydrogen from any source, the end cost of energy would be ten times higher than imported liquid natural gas (LNG), the most expensive form of imported energy regularly used today, not that DNV makes that comparison anywhere in their report. Making energy ten times more expensive is a recipe for economic disaster, and so will fall by the wayside. And as noted, DNV is incredibly optimistic, so green hydrogen will actually be more expensive than they project.
Of course, in addition to being deeply misleading about the actual available energy, it’s framing hydrogen in terms of energy, not as an industrial feedstock. The fundamental assumption that the DNV report makes is that hydrogen will replace oil, natural gas, and coal as a primary energy carrier for Europe’s economy. (DNV also ignores the balance of plant energy draws, assumes cheap electrolyzers, and assumes that hydrogen pipelines are more efficient than HVDC transmission, all deeply questionable choices.)
Is DNV alone in this bad framing? No, the new European EEX Hydrix green hydrogen index also uses MWh as the unit for hydrogen too, as I noted when calculating the rapidly inflating quality discount for Alberta’s crude oil recently. The index is a good idea, gathering commercial deal data, normalizing and aggregating it. But it’s stuck in this hydrogen-for-energy paradigm.

So yes, despite hydrogen not being used for energy today, Europe is framing everything about hydrogen today in terms of the electricity required to manufacture green hydrogen, as if that is a unit of available energy. They are explicitly making a comparison to the way that Europe measures natural gas, also in MWh. It also uses the lower heating value, which is unrepresentative of the actual efficiency of the process. Why? Because the EU hydrogen strategy does.
And to be clear, it’s ambiguous about whether the Hydrix index is using the energy required to manufacture hydrogen, although the reference to lower heating value suggests that’s the case, or whether it’s using it from a perspective about its actual embodied energy.
So, next question. Is it appropriate for Europe to measure natural gas in terms of MWh? It is, depending on the conversion factor used. The largest use case for natural gas is, after all, generation of electricity. As long as the spark spread — the average difference between the cost of gas delivered on the gas transmission system and the power price — of 50% is used, it’s a useful measure. Industrial users, who often use natural gas for heat much more directly, know how to convert it. Residential users, another large but diminishing natural gas market, don’t know what MWh are anyway.
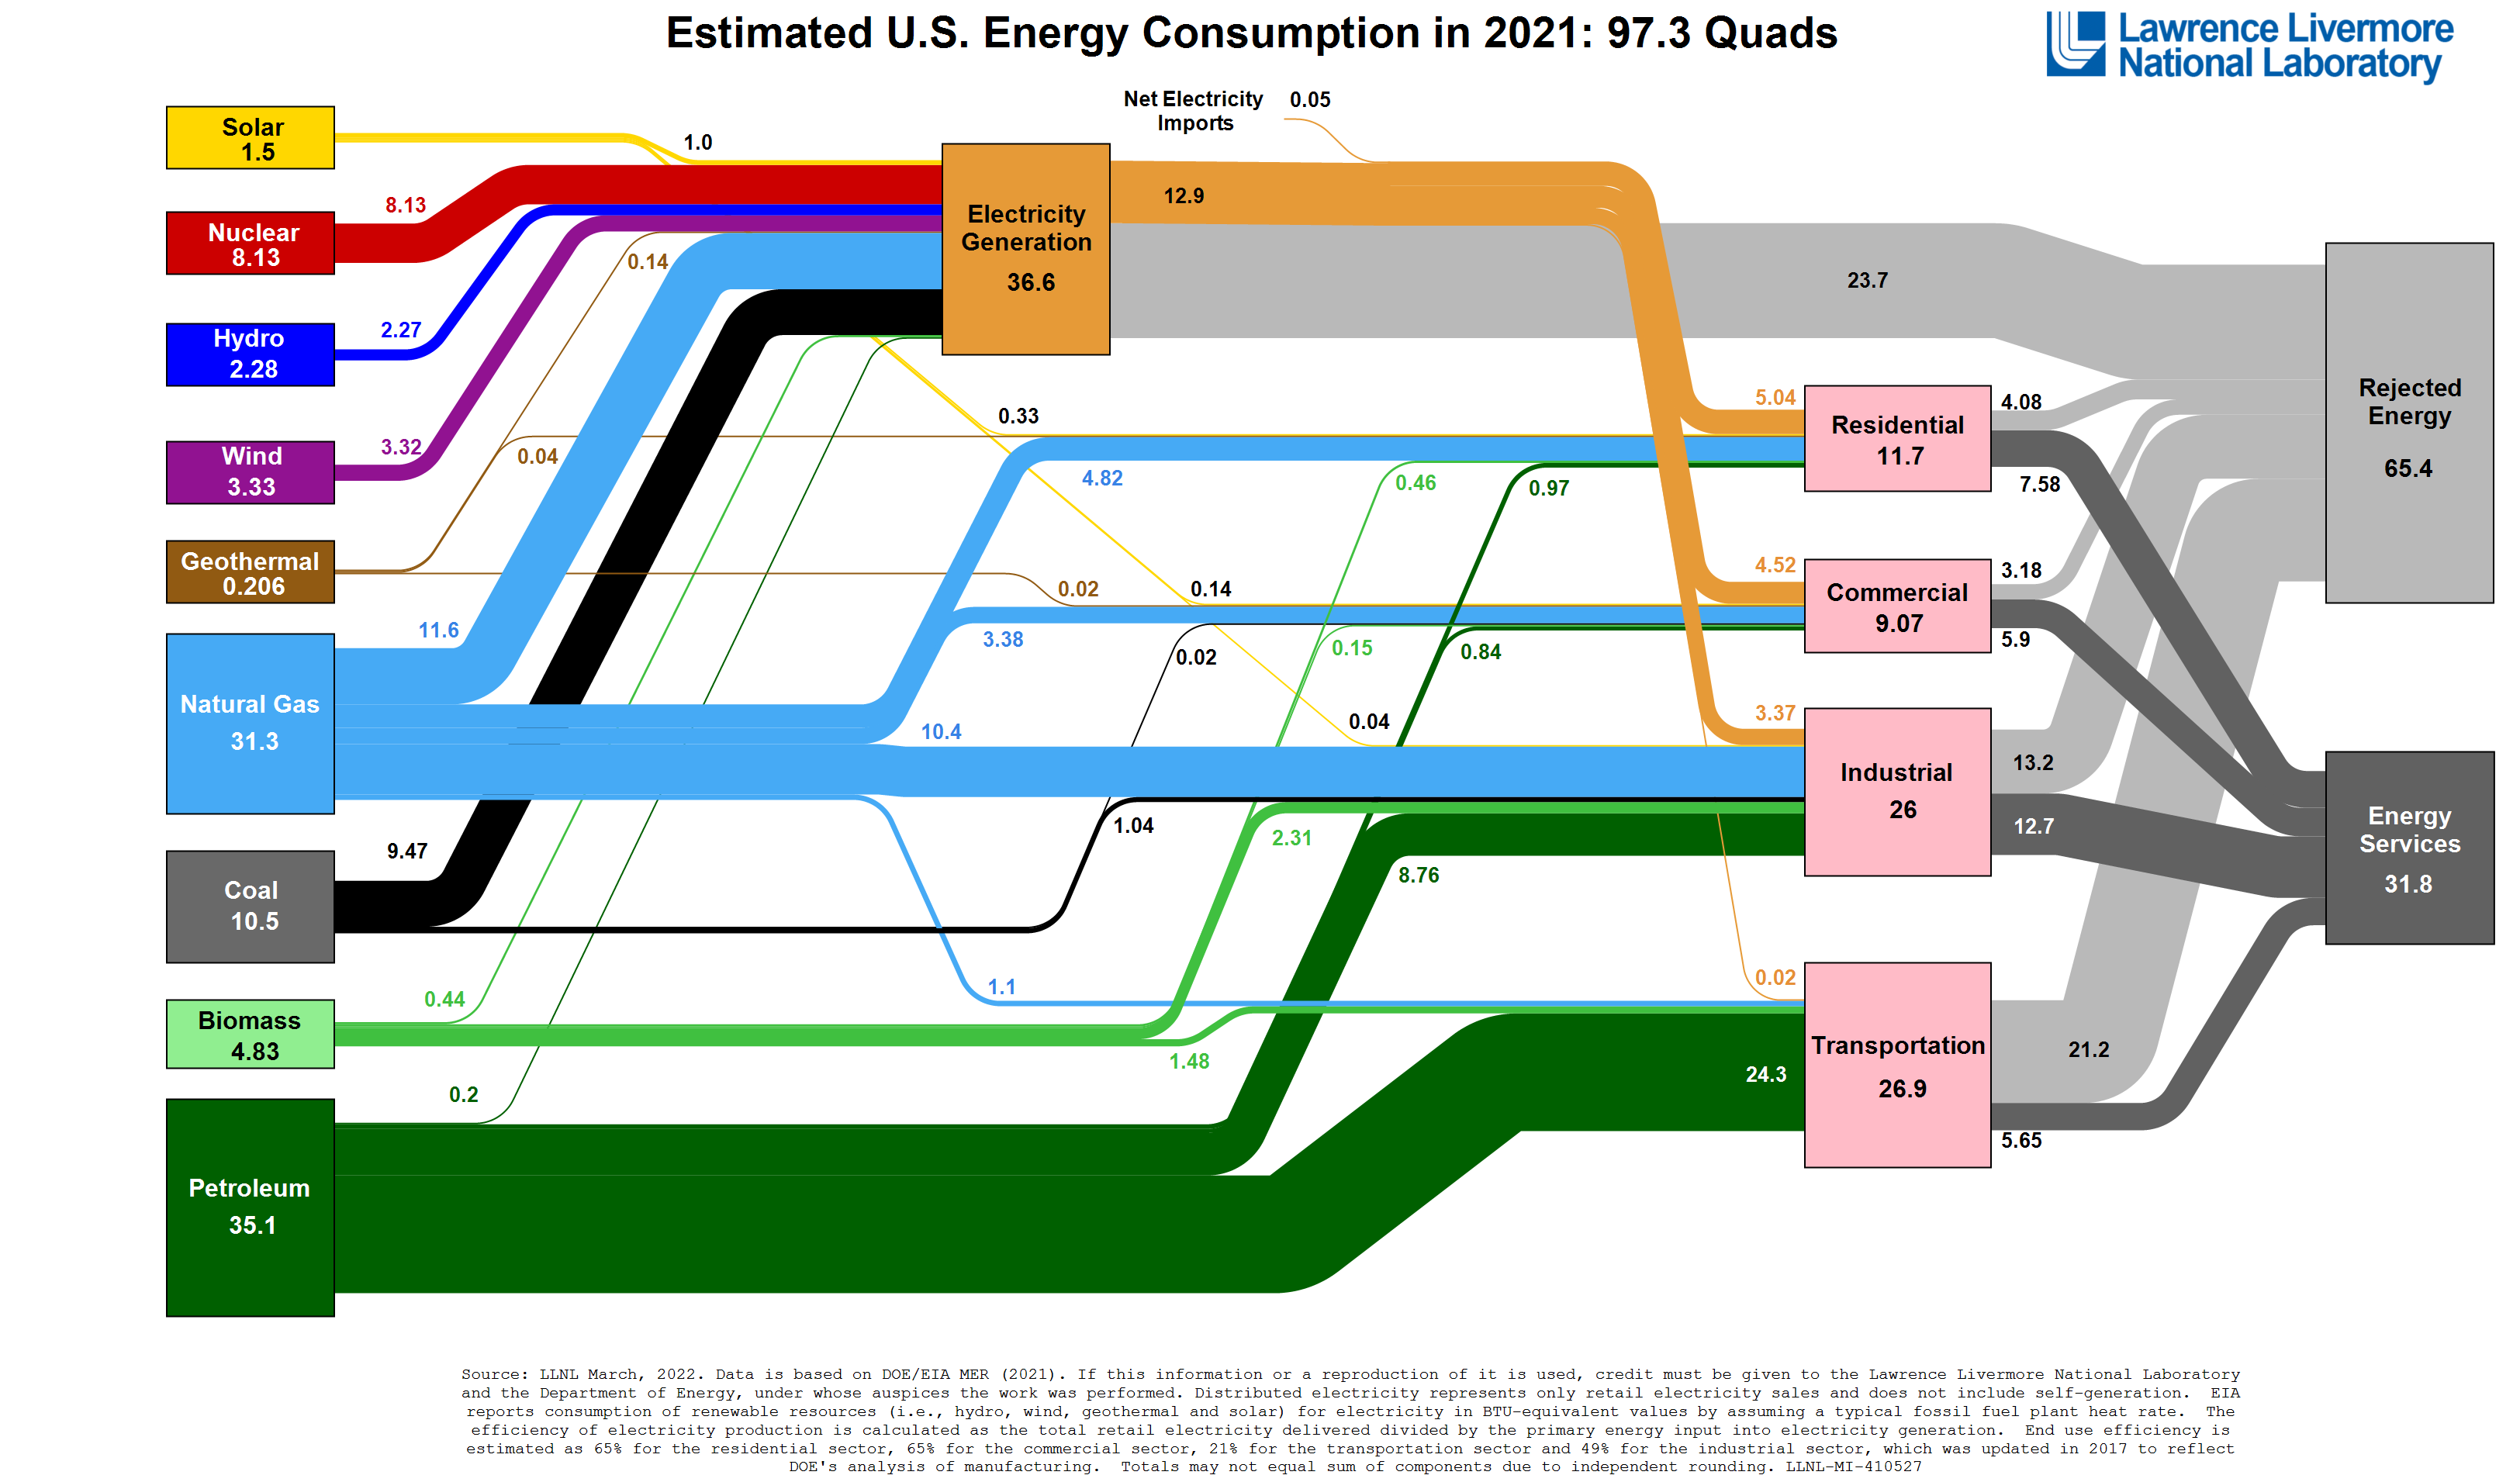
This is a diagram regularly used by me and many other energy analysts. It’s a Sankey diagram of energy flows from primary energy to energy services. It’s a useful tool, especially when you look at rejected energy in its prominent place on the upper right. Rejected energy is energy we throw away. We don’t use it. It’s just vented into the atmosphere. It’s high entropy and useless to us. It’s possible to capture a tiny fraction of it and shift it into district heating solutions, but that’s by far the exception rather than the rule.
Look at the gray bar coming out of Transportation on the bottom right, for example. 80% of the energy that flows into that box just disappears, making the air above highways hotter and flowing out of the engines of jets and the smokestacks of ships. Compared to the energy from the sun hitting the Earth, it’s an infinitesimal amount of heat, but compared to the primary energy flowing into the system, it’s huge.
This diagram, which is entirely about energy, uses quadrillions of British thermal units (Btu) as its unit of energy. (Cue irony sound effect.) That’s a much poorer choice for energy than the European model because the Btu is so unrepresentative of the energy coming out the other end. If you need heat, it’s pretty good. But if you need electricity — and the world is electrifying rapidly — then it’s a bad choice.
All of those energy boxes on the left of the diagram are in quadrillions of Btu, but we don’t need to replace them as we move to much higher efficiency electric energy uses powered by renewables where nature gives us the fuel for free, so we have no efficiency losses to speak of when converting it to actually useful electricity.
And so, to a recent piece by the US Energy Information Administration here in CleanTechnica: Nonfossil Fuel Energy Sources Accounted For 21% Of U.S. Energy Consumption In 2022.

Still in quads, obviously. And it’s extolling the growth of non-fossil fuel shares of energy. So the question is, how do they calculate the Btu for wind, solar, and water, as obvious examples?
There are a lot of choices. Zenon Research, a European climate tech think tank, just published an assessment of the problem, calling for standardization.

They talk about the different ways to get to energy equivalents. The above graphic shows the three primary methods used. Substitution adds the inefficiencies of thermal generation to the wind, solar, and water, answering the question “If we had to burn natural gas for this, how many thermal units of gas would be required for the same electricity?” It’s the spark spread of 50% again, but of course, that means picking the right number for the spark spread. It gets everything into the same units, but the units are bad.
The direct equivalent method just uses the output of wind, solar, and water as is, assuming 100% efficiency of turning wind into useful energy. That’s obviously missing transmission and the like, so is differently imperfect, but much closer to useful.
 Chip in a few dollars a month to help support independent cleantech coverage that helps to accelerate the cleantech revolution!
The physical energy content method uses the direct equivalent method for wind, water, and solar, and a conversion factor for thermal pathways due to their energy losses.
So what does the EIA data use? Are those actual units of energy, with the actually useful electricity correctly represented, are they grossed up with thermal inefficiencies, or what?
“Beginning with the September 2023 Monthly Energy Review (MER), we will calculate consumption of noncombustible renewable energy for electricity generation using the captured energy approach, which applies a constant conversion factor of 3,412 British thermal units per kilowatthour (Btu/kWh), the heat content of electricity. This is a change from our current methodology, called the fossil fuel equivalency approach.”
Well, they are about to change and confuse everybody.
So if they are going to direct Btu in September, what are they using in the diagram above? That’s actually a question I’ve been trying to figure out for a while with the LLNL Sankey diagrams as well, as their brief footnote was remarkably uninformative.
It took a long time to get to the bottom of this, and when I say bottom, I mean the bottom row on a big small-print table on page 241 of the EIA’s June 2023 Monthly Energy Review report. At present, for wind, water, and solar PV, they are using 8,844 Btu as the energy equivalent. That equates to a 39% efficiency factor, representative of a lot of thermal generation that’s well below natural gas combined cycle generators.
Okay, so the EIA is aligning with the rest of the world on how they represent energy from renewables. Are they doing the same for fossil fuels?
Well, no.
That means as of September, the EIA will start representing renewables as a much smaller portion of the USA’s energy mix than they are in reality, cutting their apparent deployment by 61%. The EIA doesn’t represent the rejected energy in the fossil fuels as the LLNL Sankey diagram, so until they address this, they are going to make renewables look awful.
The 21% win that they are claiming in the CleanTechnica article, and presumably other press efforts, is going to be severely degraded in future reporting. Basically, the EIA is steaming away from apples-to-apples comparisons. One has to ask why.
So, two major economies, the EU and the United States. Two different problems with how they represent things. The EU is failing by applying units of electricity to hydrogen. The United States is failing by removing apples-to-apples comparisons of fossil fuels to renewables. Both are struggling with the transition in different ways.
Have a tip for CleanTechnica? Want to advertise? Want to suggest a guest for our CleanTech Talk podcast? Contact us here.
Latest CleanTechnica.TV Video

CleanTechnica uses affiliate links. See our policy here.