New Plant Hardiness Map, Used By Gardeners Nationwide & Based On OSU Climate Data, Unveiled
The U.S. Department of Agriculture today released its new Plant Hardiness Zone Map, the national standard by which gardeners can determine which plants are most likely to survive the coldest winter temperatures at a certain location.
The USDA describes the latest map, jointly developed by Oregon State University’s PRISM Climate Group and the USDA’s Agricultural Research Service, as the most accurate and detailed it has ever released.
PRISM, part of the OSU College of Engineering, stands for Parameter-elevation Regressions on Independent Slopes Model. The previous version of the plant hardiness map, also based on PRISM data, was released in January 2012. The new plant hardiness map incorporates data from 13,412 weather stations, compared to the 7,983 that were used for the 2012 edition.
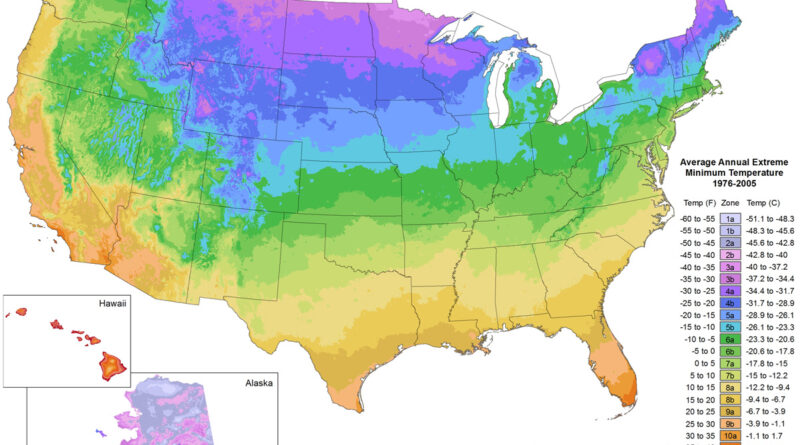
Viewable in a Geographic Information System-based interactive format, the map is based on 30-year averages (1991 to 2020) for the lowest annual winter temperatures within specified locations. The 2012 edition was based on averages from 1976 to 2005.
Low temperature during the winter is a crucial factor in the survival of plants at specific locations. The latest edition of PRISM’s signature product, the 30-year climate normals, was released in December 2021. PRISM releases new climate normals every 10 years, taking away one decade’s worth of data and adding another.
“The addition of many new stations and more sophisticated mapping techniques using the latest PRISM technology led to a more accurate and detailed Plant Hardiness Zone Map but also produced localized changes that are not climate related,” said Christopher Daly, director of the PRISM Climate Group and the map’s lead author.
The plant hardiness map is divided into a total of 13 zones, each zone representing a 10-degrees-Fahrenheit range of temperatures. Each zone is further divided into two half zones, with each of those representing a 5-degree range.
“Overall, the 2023 map is about 2.5 degrees warmer than the 2012 map across the conterminous United States,” Daly said. “This translated into about half of the country shifting to a warmer 5-degree half zone, and half remaining in the same half zone. The central plains and Midwest generally warmed the most, with the southwestern U.S. warming very little.”
Accompanying the new map is a “Tips for Growers” feature that provides information about Agricultural Research Service programs likely to be of interest to gardeners and others who grow and breed plants.
The approximately 80 million American gardeners and growers are the most frequent map users, according to the USDA. In addition, the USDA Risk Management Agency uses the map in setting certain crop insurance standards, and scientists incorporate the plant hardiness zones into research models, such as those looking at the spread of exotic weeds and insects.

About the OSU College of Engineering: The college is a global leader in artificial intelligence, robotics, advanced manufacturing, clean water and energy, materials science, computing, resilient infrastructure and health-related engineering. Among the nation’s largest and most productive engineering programs, the college awards more bachelor’s degrees in computer science than any other institution in the United States. The college ranks second nationally among land grant universities, and fifth among the nation’s 94 public R1 universities, for percentage of tenured or tenure-track engineering faculty who are women.
Courtesy of Oregon State University
More from U.S. Dept of Agriculture:
This page allows you to find and download state, regional, and national Plant Hardiness Zone Maps at various resolutions. Click on the map below to download state/territory maps or scroll down to find regional and national maps for download. Poster-sized print quality national maps and simplified map components are also available below.
The USDA Plant Hardiness Zone Map is the standard by which gardeners and growers can determine which perennial plants are most likely to thrive at a location. The map is based on the average annual extreme minimum winter temperature, displayed as 10-degree F zones and 5-degree F half zones. A broadband internet connection is recommended for the interactive GIS-based map above.
Have a tip for CleanTechnica? Want to advertise? Want to suggest a guest for our CleanTech Talk podcast? Contact us here.
Latest CleanTechnica.TV Video

CleanTechnica uses affiliate links. See our policy here.