April 24, 2023
Net Zero Consortium for Buyers U.S. VPPA Opportunity Index: 2023 Q1
SR Inc was pleased to guide and represent Member-Clients in multiple virtual power purchase agreements (VPPAs) through the Net Zero Consortium for Buyers (NZCB) in Q1 2023 in the U.S. and Europe. Whether receiving NZCB buyer advisory services in aggregated or independent VPPA procurements, all SR Inc Member-Clients of sufficient scale are interested in VPPAs as they move towards 100% renewable energy as a core part of their Science Based Targets Initiative (SBTi)-aligned journey to Net Zero Emissions.
NZCB participants were delighted to see the first indicators of reduced costs for developers due to several billion dollars in long-term subsidies through the Inflation Reduction Act (IRA) in the U.S. and the Green New Deal in the European Union. These are expected to meaningfully increase overall supply over the next decade, but developers are still evaluating exactly how their projects could benefit, which may lead to protracted VPPA negotiations. Like in 2022, developers are still facing interconnection backlogs, uncertainty from the Uyghur Forced Labor Prevention Act and the Auxin tariff circumvention case, higher interest rates, and the lingering impacts of Russia’s invasion of Ukraine. These factors, in addition to skyrocketing corporate interest in long-term corporate contracting for utility-scale renewable energy, has kept prices rising in the U.S. VPPA market overall.
Nevertheless, for the first time in over a year, the NZCB’s buyers’ reverse-auctions in both the U.S. and Europe produced offers in Q1 more than 10% below the initial RFP round. NZCB participants were also pleased to see a greater responsiveness and customer focus from world leading developers. Dozens of top developers are demonstrating a greater willingness to understand and respond to the corporate procurement function’s specific needs (compared to the utilities, energy investors, and even energy teams at the world’s largest corporations to which they regularly sell) than they were in 2022. SR Inc sees all this as a promising sign that the two-year sellers’ market is slowly becoming more equitable and more promising for exceptionally risk-averse corporate procurement functions contracting to advance needed environmental leadership.
This may be practical evidence of the move from a pronounced sellers’ market to a more balanced market wherein the best positioned and most ambitious developers are willing to pass on lower costs to offtakers. Anecdotal evidence – even when involving dozens of top corporate buyers and dozens of world-leading renewable energy developers in the U.S. and Europe – is more informative than decisive. Consequently, the NZCB invests deeply in the world’s most respected data service providers and applies NZCB’s proprietary analytics.
One deliberately simple output of these analytics is the NZCB VPPA Opportunity Index, which SR Inc has been proud to publish quarterly since 2019 to help advance our mission to accelerate the development and adoption of best practices in more sustainable business. The NZCB VPPA Opportunity Index enables a comparison of potential wind and solar VPPA performance across U.S. hubs using common analytics. It reflects both prior actual (backcast) performance and forward carefully modeled pricing and is based on proprietary SR Inc analytics and key data sources including those provided by SR Inc partners LevelTen Energy and REsurety. We call readers’ attention to the fact that the Index is based upon VPPA offers, not executed transactions, that were made over the prior quarter.
Key findings from our Q1 analysis include:
- Top quartile offered wind VPPA prices across the country were up 18% on average from the previous 12 months, while offered solar VPPA prices were up 20%.
- In the past quarter, average realized wind electricity prices in Q1 2023 were down 31% across active hubs from Q1 2022 and realized solar electricity prices were down 29%.
- Our longer-term view Opportunity Index shows that average modeled cashflow through Q1 2038 per 10MW VPPA across hubs decreased $136K in Q1 versus Q4 2022 for wind and decreased $206K for solar.
- In Q1, wind VPPAs modeled to be less expensive in 36% of all active hubs versus buying unbundled RECs (based on the current cost of a 10-year strip of national Green-e RECs at $4.50/REC), and solar VPPAs modeled to be less expensive in 35% of all hubs.
- The average modeled hub annual cashflow for a 10MW wind VPPA would have been $135K more expensive than buying a 10-year strip of the equivalent number of unbundled RECs, and the average modeled hub annual cashflow for a 10MW solar VPPA would have been $68K more
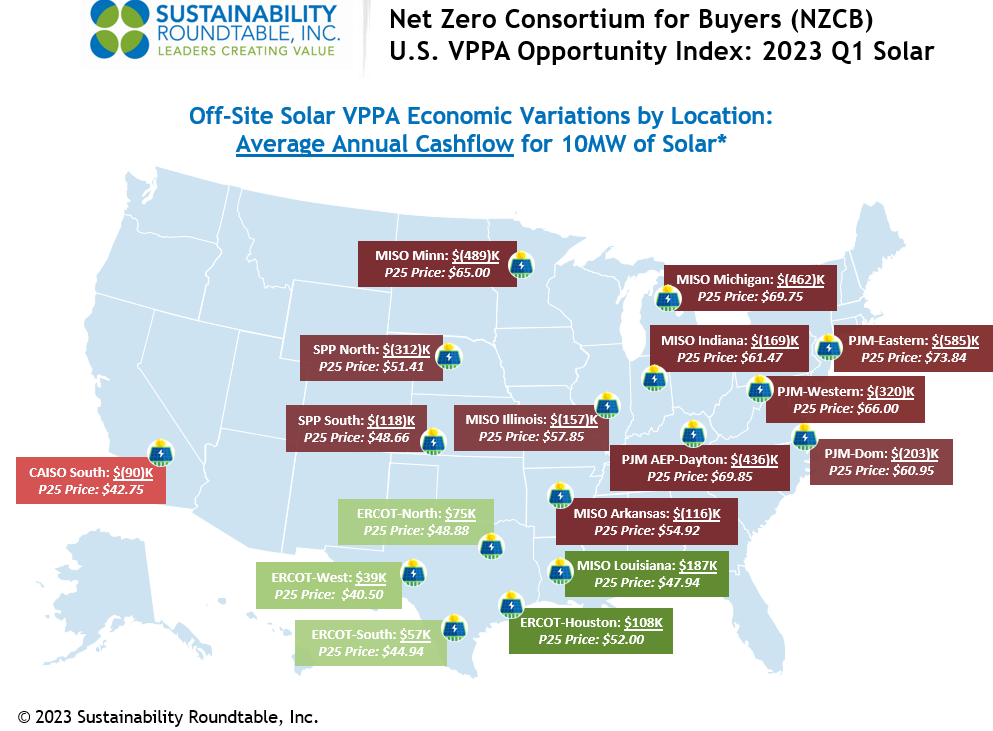
- Price modeling shows that ERCOT (Texas) solar continued to present strong opportunities for positive cash flow in Q1. The average modeled ERCOT annual cashflow for a 10MW solar VPPA was $70K.
- MISO Louisiana solar also presented strong possibilities for positive annual cashflow in Q1 ($187K per 10MW).
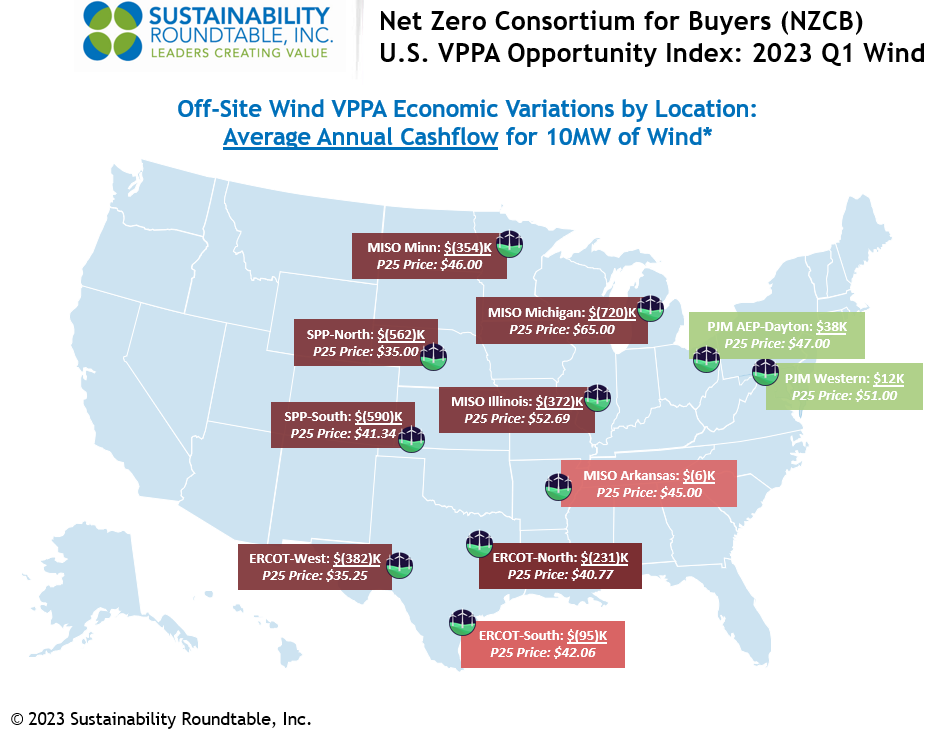
- For wind VPPAs in Q1, price modeling shows that PJM AEP-Dayton ($38K per 10MW) and PJM Western ($12K per 10MW) presented the best opportunities for positive annual cashflow.
- To underscore the importance of careful procurement, SR Inc’s NZCB solar procurements in ERCOT North & MISO Illinois in final contracting in Q1 2023 project an average positive annual cashflow of $83K per 10MW.
The NZCB VPPA Opportunity Index is an intentionally simplified rendering of complex markets, but NZCB participants find it helpful in beginning to gain an understanding of VPPA market dynamics and financial implications for implementing their renewable energy strategies through VPPAs and aggregated VPPAs. In pursuing any specific VPPA opportunities, SR Inc works with NZCB participants to provide deep stakeholder briefings and detailed and custom analytics before transacting. This type of assistance that VPPA offtakers need requires financial, legal, and market expertise to drive timely procurement strategy development and implementation, transaction structuring, contracting, and negotiation services to create a successful and auditable corporate procurement process in rapidly changing markets.
*Methodology
- To calculate average annual cashflows, SR Inc multiplies 1) the difference of technology-shaped realized market prices (2016-2023) & forecasted technology-shaped electricity futures market prices (2023-2038) versus top quartile VPPA prices in each hub by 2) the typical total annual production for 10MW offtakes for wind and solar, respectively.
- SR Inc uses 36K MWh production per year for 10MW of wind and 24K MWh per year for 10MW of solar to provide “apples to apples” comparisons for both technologies across hubs.
- The top quartile VPPA price assumes a scaled offtake of at least 50MW, but SR Inc uses 10MW because it is typically the minimum individual corporate offtake required within 100+ MW aggregated procurements REPS manages for NZCB participants.
Data Sources
- The NZCB Opportunity Index is developed from proprietary analytics and multiple data providers, which include:
-
- LevelTen Energy PPA Price Index North America top quartile VPPA pricing data for Q1 2023 (all proposed projects of 8+ years)
- REsurety REmap actual average, technology-shaped realized market prices for Q2 2016-Q1 2023 and technology-shaped future market price forecasts for Q2 2023-Q1 2038 (as of April 18th, 2023) based on multiple electricity futures markets.
If you have any additional questions, or would like to learn more about the NZCB, contact info@sustainround.com.