April 25, 2022
Net Zero Consortium for Buyers VPPA Opportunity Index: 2022 Q1
In the first quarter of 2022, an unprecedented number of increasingly diverse corporate off-takers competed to pay rising prices for long-term REC procurements. They did this to help cause new renewable capacity instead of buying RECs from long-existing renewable energy projects that are technically permitted by the GHG Protocol but are viewed by SR Inc Member-Clients as less attractive than RECs from renewable projects they helped cause. This stampede to what SR Inc describes as “Purchaser Caused RECs” has enabled Developers to pass on increased supply chain costs and therefore have narrowed modelled likely returns to corporate off-takers.
Whether working with fellow SR Inc Member-Clients in the Net Zero Consortium for Buyers (NZCB) or with independent buyer advisory services, all SR Inc Member-Clients of sufficient scale are interested in the VPPA market as they chart paths to Net Zero Emissions globally. Every quarter since 2019, SR Inc has therefore been pleased to offer the NZCB VPPA Opportunity Index that enables a comparison of potential wind and solar VPPA performance across U.S. hubs using common analytics. The Index reflects both prior actual (backcast) performance and forward carefully modeled pricing. The Opportunity Index is based on proprietary SR Inc analytics and key data sources including those provided by SR Inc partners LevelTen Energy and REsurety. SR Inc treats the Index as a trailing indicator since these VPPA offers were from the prior quarter, and largely do not reflect the continued energy price climb over the past year due to the Russian invasion of Ukraine, nor the recently elevated VPPA prices due to the Commerce Department solar antidumping duty (AD) and countervailing duty (CVD) inquiry.
Key findings from our Q1 analysis include:
- Wind VPPA prices across the country were up 21% on average from the previous 12 months, while solar VPPA prices were up 14%.
- In the past quarter, average realized wind prices in Q1 2022 were up 19% outside of ERCOT across hubs from Q1 2021 (for Q1, ERCOT does not provide a good benchmark as Q1 2021 prices were extremely high due to February 2021 Storm Uri) and solar prices were up 43% (excluding ERCOT for the same reason).
- Despite the last quarter realized price rises, our longer-term view Opportunity Index shows that average modeled cashflow through 2036 per 10MW VPPA across hubs was still down$58K in Q1 versus Q4 for wind but up $35K for solar (excluding the extreme negative cashflows in New York).
- In Q1, wind VPPAs modeled to be less expensive in 44% of the hubs versus buying unbundled RECs (projecting out the current $4.15/REC cost), and solar VPPAs modeled to be less expensive in 65% of all hubs (and 83% of hubs outside of New York).
- The average modeled hub annual cashflow for a 10MW wind VPPA would have been $13K more expensive than buying the equivalent number of unbundled RECs at today’s costs, and the average modeled hub annual cashflow for a 10MW solar VPPA (excluding the extreme negative cashflows in New York) would have been $190K less expensive than buying the equivalent unbundled RECs at today’s costs.
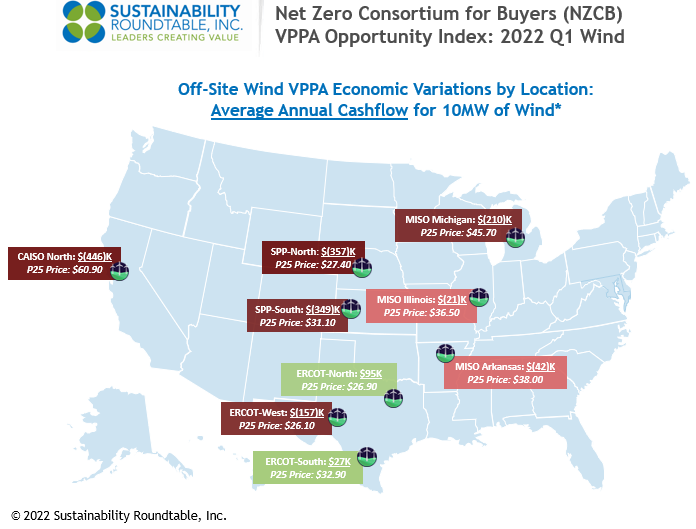
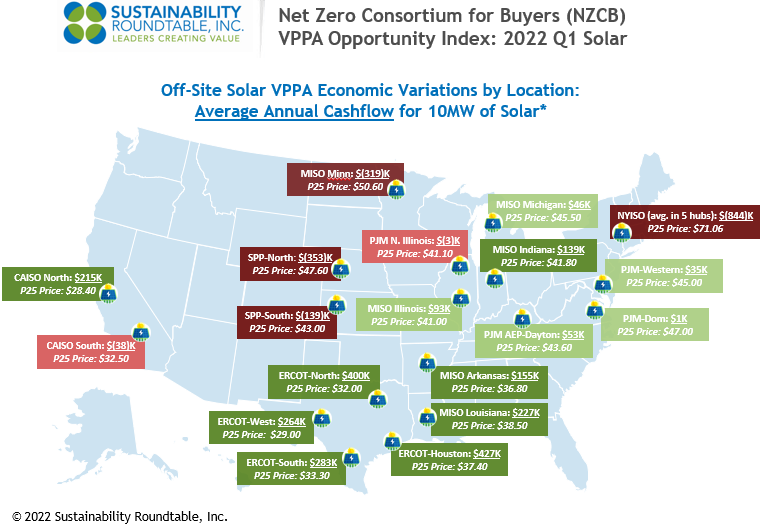
- Price modeling shows that ERCOT (Texas) solar presented the strongest opportunities for positive cash flow in Q1. The average modeled ERCOT annual cashflow for a 10MW solar VPPA was $343K.
- Price modeling shows that ERCOT also continued to present the best opportunities for wind in Q1. However, due to continued VPPA price increases in Q1, the average modeled ERCOT annual cashflow for a 10MW wind VPPA was down to $(12)K.
- Price modeling shows that solar also presented cash positive opportunities in multiple MISO hubs (AR, IL, IN, LA, and MI), PJM hubs (AEP-Dayton, Dominion, and Western) in addition to CAISO North (California) in Q1.
The NZCB VPPA Opportunity Index is an intentionally simplified rendering of complex markets, but NZCB participants find it helpful in beginning to gain an understanding of VPPA market dynamics and financial implications for implementing their renewable energy strategies through VPPAs and aggregated VPPAs. In pursuing any specific VPPA opportunities, NZCB participants require very detailed and custom analytics performed with senior expert assistance before transacting. This assistance requires financial, legal, and market expertise to drive timely procurement strategy development and implementation, transaction structuring, contracting, and negotiation services to create a successful and auditable corporate procurement process in rapidly changing markets.
*Methodology
- To calculate average annual cashflows, SR Inc multiplies 1) the difference of technology-shaped realized market prices (2015-2021) & forecasted technology-shaped electricity futures market prices (2022-2036) & top quartile VPPA prices in each hub by 2) the typical total annual production for 10MW offtakes for wind and solar, respectively.
- SR Inc uses 36K MWh production per year for 10MW of wind and 26K MWh per year for 10MW of solar to provide “apples to apples” comparisons for both technologies across hubs.
- The top quartile VPPA price assumes a scaled offtake of at least 50MW, but SR Inc uses 10MW because it is typically the minimum individual corporate offtake required within 100+ MW aggregated procurements REPS manages for NZCB participants.
Data Sources
- The NZCB Opportunity Index is developed from proprietary analytics and multiple data providers, which include:
- LevelTen Energy PPA Price Index top quartile VPPA pricing data for Q1 2022 (all proposed projects of 8+ years)
-
- REsurety REmap actual average, technology-shaped realized market prices for 2015-2021 and technology-shaped future market price forecasts for 2022-2036 (as of March 31, 2022) based on multiple electricity futures markets.
If you have any additional questions, or would like to learn more about the NZCB, contact info@sustainround.com.