
 (Photo by iStock/Kenishirotie)
Imagine two humanitarian startups. One sends drones into isolated villages in remote areas of South Africa to deliver food, water, medicine, and vaccines. The other is a new organization based in Mexico that creates game-based learning tools. Using artificial intelligence (AI), it detects learning disabilities at a young age to improve children’s education. How do investors compare the social impact of these two projects? How can funders of humanitarian solutions assess the potential for impact and track the performance of solutions across their portfolios?
These questions pervade the world of impact investing, and the problem is this: The “inputs” of the investment (dollars of capital invested) and the “outputs” returned to the investor (social value of the project) are fundamentally different units. Outputs also vary from organization to organization, project to project.
This problem has troubled investors since the industry’s inception. Often even the most sophisticated organizations share only broad metrics such as, “Project X impacted 100,000 children,” with no additional details. Others simply measure the outputs of the project. If a project delivers workshops in Nepal that teach children how to wash their hands, for example, it would likely report the number of workshops it conducted instead of what you really want to know: “The number of sick children declined by 37 percent.”
Two available but underused tools for measuring social impact outcomes are social return on investment (SROI) and impact multiple of money (IMM), which are ratios between the inputs and outcomes of a social program. If you have an SROI of 4:1 or an IMM of 4x, then for every dollar allocated, you generate a social value of four dollars.
Are you enjoying this article? Read more like this, plus SSIR's full archive of content, when you subscribe.
Calculated well, these measurements are more useful than simply reporting the number of beneficiaries, and their focus on outcomes instead of outputs represents important progress in measuring meaningful social return. However, they’re also based on the premise that the social outcome can be monetized as “social value.” While this works nicely for projects where the social outcome is already expressed in financial terms (for example, percentage increase in farmers’ income), it’s difficult to use a financial proxy for non-monetary outcomes, especially in health and education. The idea of “monetizing” the value of a child’s life is not an ideal approach, and it’s hard to gather enough data to get precise comparisons for programs at a very early stage.
Measuring ‘Competitive Sustainability’
To overcome these obstacles, I developed an outcome-based framework to help social venture investors track the performance of their investments, gauge their viability, and identify projects with the greatest odds for social good. I initially developed this framework at UNICEF’s Venture Fund as a mechanism for tracking investments and assessing follow-on candidates, but I have since adapted it to support the growing social investment landscape, regardless of portfolio strategy. The system, while imperfect, helps inject objectivity to our analysis, compare projects, and bring more analytic rigor to the funding and portfolio management process.
The concept behind it is simple: Evaluate the “competitive sustainability” of the solutions—their ability to succeed over the long-term and against alternative solutions—while capturing as much data as possible on social impact. Competitively sustainable solutions must deliver a better product than other available options. Or be cheaper. Or deliver a new product entirely. Without competitive sustainability, there’s a clearly defined ceiling on the project’s social return. No project can generate a massive social return if customers adopt an alternative solution over time. Fundamentally, if you want to generate a large social return, you must first identify social businesses that are competitively sustainable.
This methodology is useful because, while it’s tricky to compare social impact metrics across organizations, funders can evaluate the competitive sustainability on an apples-to-apples basis. They can identify comparable points that help evaluate the foundational strengths of businesses to sustain their social impact.
The framework has three categories: technology, financial sustainability, and social impact metrics. The first two speak to the organizations’ competitive sustainability; the third captures the nuance of social return.
1. Technology
Without high-quality technology, a tech-driven social venture can’t deliver long-term social returns. Target beneficiaries don’t widely adopt weak solutions to begin with, and weak solutions can be easily displaced. We track technology metrics to determine either how competitive the underlying technology is today or how competitive it will be once it hits the market.
Because I initially built this framework when managing a portfolio of open-source solutions, we use open-source metrics to assess the relative strength of each of our portfolio organizations’ software projects. These are widely available on open-source platforms like Github, and we can use them to benchmark projects against one another because they are standardized across projects. Comparability is key. The data we collect allows us to assess the strength of the technology itself—a proxy for understanding which of our portfolio companies will likely produce the most competitively sustainable solution, now or in the future.
We track four qualities to determine an open-source project’s health:
- Activity: How consistently are developers updating the software?
- Visibility: Is the solution well-known in the open-source community?
- Responsiveness: Is the software properly managed and updated?
- Knowledge distribution: Is the software dependent on one person or is it distributed within a community?
Rather than simply comparing the absolute value of each open-source metric, which can vary widely from project to project, we use a tiered scoring system. We score each metric on a scale of one to five. For example, for responsiveness, we track the average time it takes to resolve issues that contributors (such as software developers) flag. A highly responsive community can help attract and retain new and existing contributors, because it acknowledges their work. If the team takes more than five days to respond, it scores a one; if it takes less than a day, it scores a five. We then roll together the scores, and create an average that we use to compare how projects perform over time and relative to each other.
2. Financial Sustainability
Technology and financial sustainability aren’t usually the first things people think of when it comes to social change, but they’re important underlying factors that enable a solution to flourish.
We track four verticals to determine a project’s financial sustainability:
- Financials: Can the project support itself? Will it ever be able to?
- Engagement: How many users, beneficiaries and customers does the product have? How fast are they growing?
- Market: What is the size of the target market? Who is the competition?
- Team: Does leadership have the diverse skill set to significantly scale the project?
As with technology, we assign each financial sustainability variable a weight and give each project a score that we can benchmark across the portfolio. Some of these metrics are straightforward and have thousands of publicly available benchmarks (such as revenue growth and operating margin for all publicly traded companies), but other metrics are more qualitative and require normalization for comparability. For example, a management team’s skill set is important to a project’s long-term financial and competitive sustainability, but “skills” are not easily quantifiable. We score skills based on a qualitative assessment of core business functions: operations, finance, strategy, sales, and marketing. A team with excellent competency in all core business functions—for example, a team that has successfully developed an innovative product and brought it to market—would score a five. A team with satisfactory competency in certain functions but several clear gaps in others would score a three. A team with no demonstrated competency in any core business function—for example, a first-time entrepreneur with a great idea but no leadership experience or formal business training—would score a one.
We then roll up these scores into a single weighted average—the key indicator for how financially sustainable a given business in the portfolio is or could become. The technology and financial categories give us insight into an organization’s competitive sustainability.
3. Social Impact Metrics
This is the final category. Because social return varies so widely across investments, especially across different sectors, it’s important to first identify the social metrics specific to each investment and then explore what can be aggregated and/or compared based on project similarities.
The most essential questions we use to identify the social impact metrics are:
- What are the social outputs/outcomes of the project?
- Who benefits from the project’s implementation?
- How do they benefit?
The first step is to define the social impact metrics tracking both output variables (such as the average time children spend on a virtual education platform) and outcome variables (such as the number of diseases a medical solution identified). After determining what each metric is, we measure the baseline level so that we can track progress. Then, for each outcome, we clarify who the benefiting ctors are, using as many demographic details as relevant (for example, 6- to 8-year-old children from Guatemala attending public schools). Last, we measure how: How many individuals benefit from that outcome over time, and how this change compares to the baseline level (such as the percent improvement of a child’s attention over a certain period). It’s important to also compare this to pre-existing alternatives and determine whether the new solution is doing better than the industry standards.
When measuring the outputs and outcomes of social ventures, it’s important to know that the metrics may change as the startup solidifies its product. Also, as projects scale, it’s possible to much more thoroughly analyze the social impact measurement by, for example, assessing how much of the change would have happened without the intervention. Using this framing for impact measurement allows any project to start measuring from its inception. Focusing on the story of the impact generated over time gives you the flexibility to modify and strengthen the measurement as the projects evolve.
The Impact Management Project, a resource born from a global consensus among organizations committed to impact measurement, offers useful guidance on understanding social impact. It helped refine this category, and I look forward to following their efforts to mainstream the practice of impact management.
Putting It All Together
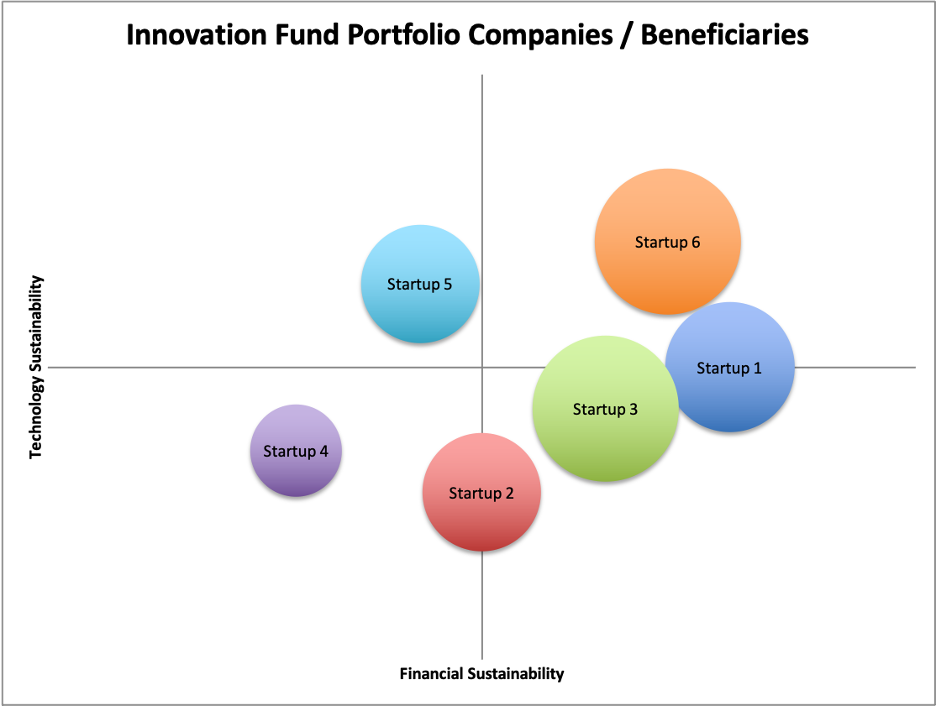
After collecting, cleaning, and scoring hundreds of data points, the technology and financial sustainability metrics can boil down to two single, weighted-average scores. These form the foundation for our analysis, enabling us to directly compare the competitive sustainability of all projects in our portfolio against one another, regardless of how unique each social innovation is. We then layer on top of this foundation any comparable social impact metric to deliver a third dimension of insight.
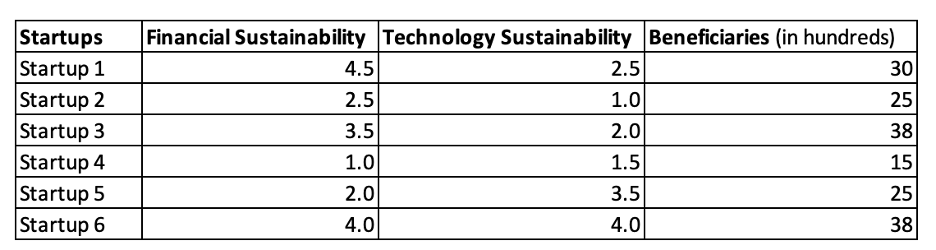
The example below uses the financial and technology sustainability scores to position several projects on the matrix. The number of beneficiaries determines the size of each bubble (no normalization needed) as a loose proxy for social impact reach. The result: Projects that appear closest to the top-right corner, particularly those with large bubble sizes, are those most likely to deliver the greatest long-term social return. These are the “crown jewels” of a social venture investor’s portfolio.
While much of this framework focuses on normalizing vast amounts of data for comparability purposes, social venture investors can also use it to break down the investment selection process into more meaningful steps. They can replace the third, social impact data set with different criteria to help “filter” project data. For example, an investor who has a mission of stopping the spread of infectious diseases in developing countries could use a social impact metric of “cases identified” as the third dimension, in place of “beneficiaries.” This would all but eliminate projects that don’t meet the investor’s mission statement. The applicable variations of this framework enable a vast array of use cases but operate under the same guiding principle: Projects that demonstrate the greatest competitive sustainability are most likely to deliver the greatest long-term social returns.
Each project will also have idiosyncratic social impact metrics that are relevant only to its industry or solution. Identifying these and keeping track of them, even if only to compare them with their own historic performance, is important to measuring progress. Assessing how a solution’s targeted social impact improves over time or compares to existing alternatives will always be critical to social investors, and we do not want to either lose or distort the importance of these metrics.
Lessons Learned
Contextualizing the tool for your specific portfolio strategy is important. No tool in this realm is “one size fits all”; investors must adapt tools to the portfolio under management and the organization’s direction.
Indeed, it’s unlikely that any social impact framework will ever provide a way to aggregate all the variables that maximize social impact across industries and report, with booming confidence, “Project A provided 50 percent more good to children than Project B.” But by gathering data and measuring it over time, we can begin to create a track record, gauge progress, and evaluate the impact of new solutions over the baseline mechanism that currently exists.
When working at UNICEF’s Venture Fund, collecting the data that this framework required provided a way to track the sustainability and impact of not only the investments, but also the portfolio as a whole. Among a portfolio of 40 investments we’ve learned, for example, that:
- In the process of working toward a strong technology score, 40 percent of the analyzed projects had expanded their solutions to new geographies. For example, Cboard, an Argentinian app that helps children with speech and language impairments, now has developers contributing from around the world. This has led to the translation of its solution to 43 languages and more than 25,000 active users.
- Thirty percent of the projects were financially competitive and received follow-on investment based on information from this analysis. One example is Thinking Machines, a social business in the Philippines that uses AI and satellite imagery to inform policy has gained funding from government agencies, international organizations, nonprofits, and corporations since 2017. The continuous improvement of its technology and growing financial health have made it one of the most competitive solutions in the portfolio and led to strong social value.
- We could look into project-specific, objectively evaluated results, rather than relying on gut instinct. For example, we know that in Mexico, 6,167 children at risk of learning disabilities have used Pixframe’s AI-infused games, sharpening their cognitive functions. More precisely, from 20 play sessions, with a minimum frequency of play (once a week for 20 minutes), attention improved on average by 14 percent, visual memory by 23 percent, and verbal fluency by 22 percent.
While the framework was built to help investors, it also helped the projects themselves. Most of the projects we analyzed didn’t track variables such as users, customers, or potential market size. The new measurement approach forced accountability, sparked conversations, and helped startup teams structure their reporting. All of this helped them when seeking additional resources.
Building a Better Measurement System
As excited as we are to see the results of our efforts so far, we recognize that social impact assessments, especially for early-stage projects, have a long way to go. We hope to see stakeholders come to appreciate more-robust measurements and share those measurements across organizational boundaries. A database of 40 social projects from a single organization’s portfolio can be helpful, but a database of 5,000 social projects from portfolios across a diverse universe of organizations would make every organization’s portfolio more impactful.
It's also more important than ever to base social venture funding decisions on objective data frameworks. Data-driven investments underpinned by a rich database of early-stage social ventures would, for example, directly lead to increased funding for historically underfunded groups like women and racial minorities, enabling portfolio managers to not only support the social projects that were most likely to create social value, but also deliver a social return themselves.
While the framework will benefit from further refinement, and all efforts to gather data and assess impact require significant effort and time, there is a valuable middle ground between just calculating the number of beneficiaries and doing a randomized, controlled trial. Having outcomes in mind and taking the time to assess those outcomes is operationally practical and allows social investors to streamline our portfolio management processes to deliver greater social good.
Support SSIR’s coverage of cross-sector solutions to global challenges.
Help us further the reach of innovative ideas. Donate today.
Read more stories by Cecilia Chapiro.