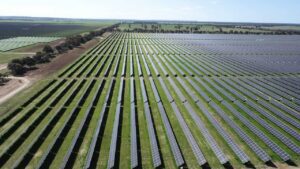
Record output of renewable energy, and solar in particular, pushed prices down across Australia in the first quarter, with the exception of the country’s most coal dependent grid.
According to new data released by the Australian Energy Market Operator on Tuesday, average wholesale spot prices on the National Electricity Market eased eight per cent from the same quarter last year, despite higher demand, and would have fallen by three times as much were it not for a series of extreme weather events.
“We are increasingly seeing renewable energy records being set which is a good thing for Australian consumers as it is key in driving prices down and NEM emissions intensity to new record lows,” AEMO’s head of reform delivery Violette Mouchaileh said in a statement accompanying AEMO’s latest Quarterly Energy Dynamics report.
“We are increasingly seeing renewable energy records being set which is a good thing for Australian consumers as it is key in driving prices down and NEM emissions intensity to new record lows.”
The QED report found that NEM wholesale spot prices averaged $76/MWh over the quarter, but would have fallen a further $17/MWh to $59/MWh were it not for a series of extreme weather events, including the storms that brought down transmission lines and led to the loss of Victoria’s biggest coal generator, Loy Yang A, on February 13.
The only state to buck the trend was Queensland, which remains the most heavily dependent on coal generation and with the smallest share of renewables (26 per cent), and which also suffered from multiple heatwaves that helped drive its average price up to $117/MWh.
Mouchaileh says Australia is still witnessing a “north-south” divide on wholesale prices, with the coal-dependent grids of Queensland and NSW ($87/MWh) having significantly higher wholesale prices by the renewables-rich South Australia ($55/MWh), Tasmania ($67/MWh)and Victoria ($52/MWh).
Victoria’s average would have been significantly lower ($37/MWh) were it not for the dramatic events of February 13, which pushed wholesale prices up to the market cap, and South Australia’s would have also been lower as it was affected by the loss of transmission capacity.
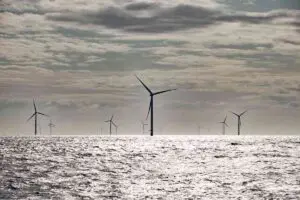
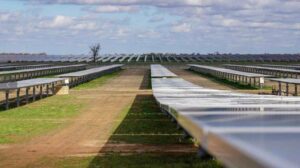
Renewables lifted their overall share of the total NEM supply to 39 per cent, up from 37.4 per cent in the same quarter the previous year, with grid scale solar jumping 18 per cent, distributed PV jumping 10 per cent and hitting record highs in all states, and wind energy rising 5 per cent.
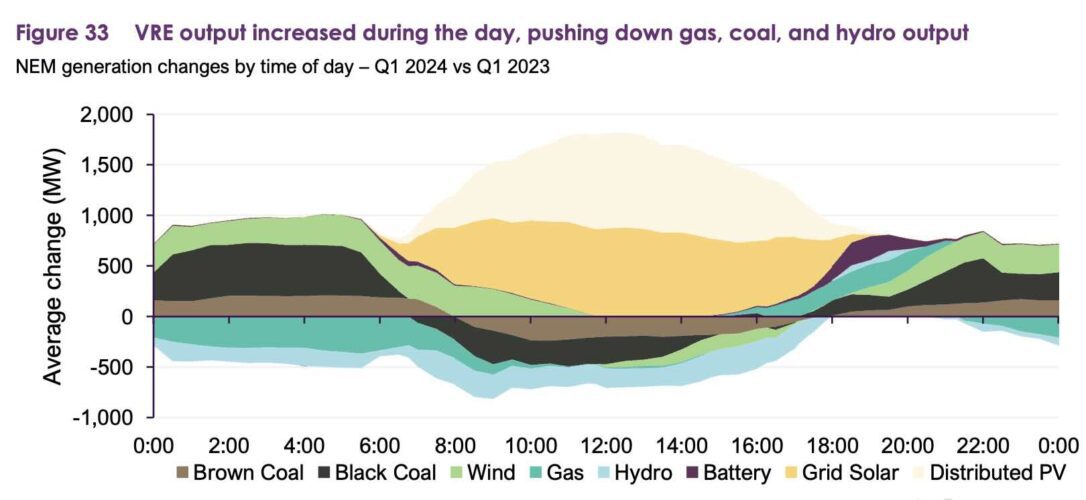
The other major changes were small increases in black-coal fired quarterly average generation (up 1.1% to an average 10,613 MW, despite the closure of Liddell last April) and brown coal fired generation (up 0.6% to 3,675 MW). Hydro fell 10% to 1,344 MW) and gas-fired generation was down 8% to an average 1,026 MW).
Output from grid-scale batteries continued to grow, more than doubling average output to a new record quarterly average of 53 MW (and an average 217 MW in the evening peak), while battery storage extended its domination of the NEM’s 10 frequency control markets to a total of 57 per cent.
Batteries also increased their influence over spot prices, setting the price on six per cent of occasions, and 10 per cent in South Australia, where it has the biggest share of the market, and where wind and solar account more than 70 per cent of generation.
Its gain across the NEM was at the expense of hydro and gas, although black coal remains the biggest force with 34 per cent (and 69 per cent in Queensland).
Futures prices also fell, with ASX base contract prices for the 2024-25 financial year (FY25) averaging $84/MWh across all mainland NEM regions, reflecting an 11% decrease from the previous quarter and a 12% decrease from the same quarter a e year ago. The biggest fall came in South Australia, with a 17% drop to $86/MWh.
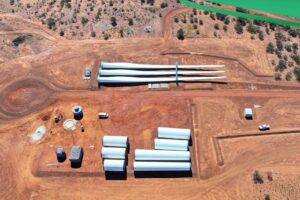
AEMO also gave an update on the new capacity progressing through the grid, saying there was 41 GW in the system, a 70 per cent increase from the same time last year, but most of this (87 per cent) remained at early stages of development.
Solar was the biggest with 43 per cent, followed by batteries (31 per cent), wind (just 18 per cent), and hydro seven per cent.
AEMO said there were 22 projects totalling 3.7 GW progressing through registration, with nine of these being registrations received during Q1, and most of this new capacity was in NSW.
There was 1.6 GW of new capacity in commissioning to full output, compared to 2.2 GW at the end of Q1 2023. This commissioning measure considers all plant in commissioning up to the plant reaching its full output.