South Australia leads the world in the uptake of wind and solar – averaging more than 71 per cent over the past year and regularly delivering more than 100 per cent of its local demand.
It’s a relatively small state with a modest economy. But now California, the world’s biggest sub-national economy, and the fifth biggest in the world if it were a country, is also setting new benchmarks for renewables, with its wind, solar and hydro resources more than matching demand over the past week.
According to Mark Jacobsen, the Stanford University academic who has outlined plans for wind, water and solar to provide the bulk, if not all, electricity needs in countries across the globe, California’s wind, water and solar resources have bested 100 per cent of local demand for varying periods in nine of the last 10 days.
On Sunday, California time, the peak was 115 per cent of demand and wind, water and solar beat demand for five solid hours.
Jacobsen says that wind, water and solar have accounted for more than 100 per cent of state demand for between one and six hours for nine out of the last 10 days. And that is one in the eye for all the naysayers.
“In 2009, when we first proposed 100% WWS, the utilities and naysayers claimed the grid would go unstable with more than 20 per cent renewable energy, with no evidence,” Jacobsen wrote on X.
“In 2017, they claimed, with no evidence, a limit of 80 per cent. In 2020, they claimed 90%, then 95% . Now 100% WWS is here to stay.”
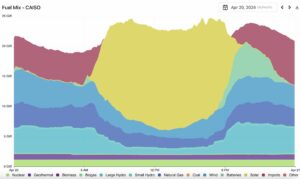
This above graph, taken from the California system operator CAISO, where Jacobsen sources his data, shows wind and solar alone accounting for all of state demand for a brief time on March 13 – a common occurrence in South Australia, but rare for a grid with demand at near 20 gigawatts.