The average residential customer across Australia’s main grid appears to be paying about $520 a year, pre GST, for the distribution component, excluding transmission, for the privilege of being connected to the grid.
Although not the focus of this note, the prices that wires and poles may charge, are set for five year periods by the Australian Energy Regulator.
The allowed revenue is based on allowing the utility to earn a return on capital, cover its opex and the negligible tax, and to cover capex (via regulated depreciation).
The vast majority of that regulatory revenue has no relationship to volume, or even time of use but is almost entirely related via the return on capital and depreciation to the size of the regulated asset base.
In extremis, if no-one used the grid at all, the owners would still be legally entitled to revenue. We see this in gas where, when it is having a bad day, the AER tries to suggest customers should pay to disconnect from the gas grid.
I argue that if we could do it all over again those fixed costs, ie return on capital and regulatory depreciation, could be embedded in the capital cost of the connection point being served.
In English I mean that just as users don’t pay an annual charge related to the cost of building the road, nor might they pay an annual charge for the cost of building an electricity network. The cost of the subdivision road is built into the cost of the lot and therefore into the cost of the house and land package.
If the same was done with electricity then the annual costs of maintaining the network is all that would be paid. Effectively the houseowner would own the wires and poles and would be sub-contracting out the maintenance.
We don’t live in that world, but I do think about it on those increasingly rare occasions when networks come to the fore. Doing that would reduce electricity bills at a stroke.

That DORC’s in the UTE again!1
General interest in the economics of the wires and poles sector has declined as the various assets, SP Ausnet, CKI, DUET, Envestra have all been taken private. Those assets are well suited to superannuation funds as the value has historically grown with inflation and risk is low. The asset value matches the superannuation fund liability.
Still, all assets have their ups and downs. In the case of the wires and poles sector there are several potential drivers of value changes.
Reductions in interest rates reduce revenues, the behind the meter sector has seemingly profound implications for volume growth, and now the rise of batteries is at odds with the regulated nature of the wires and poles business.
One of the more useful accomplishments of the AER has been to get some standarised reporting from the various utilities it regulates.
Warning
From the customer bill perspective, this analysis looks backward. Looking forward inflation and other factors could be expected to drive a 10% increase in network revenue over the next 3 years.
Method
We downloaded “Economic benchmark RIN Templates” .xlsx templates for 13 electricity distribution business in the NEM for each of the years 2018-19 – 2022-23 and then loaded selected data into data frames using XLwings for Python. Some templatets were named for a calendar year rather than a financial year and ITK assigned them to financial years.
We aggregated the data into NEM wide wires and poles “view”. 2 for selected data.
Happier consumers
A summary of the aggregated view is:

As a regulator or a consumer you have to be happy with a overall $0.90 MWh increase in residential bills per customer between 2018-19 and 2022-23, despite significant inflation in that that time. For the average residential connection consuming a net 5 MWh of electricity the bill has gone up by less than $5 over the five years.
As an investor in a network I’d observe that the RAB has grown from $144 billion to $166 billion but overall revenue has barely changed. Although it’s not explicitly stated if residential revenue is up by $2bn to over $5bn but total revenue is flat at $1 bn there has to have been a decline in other areas.
Noting that from a financial point of view the fact that profits and revenue are regulated means that if revenue has declined it is because the WACC3 , opex or depreciation has declined. To a lesser extent it may also be because the AER has cramped the utilities outperformance.4
A final observation from this high level table is that residential customer growth totalling 5% or about 0.5 million is encouraging. The customer growth has much to do with residential volume and revenue growth but also leads to significant capital expenditure for the new connections.
Big and small, city and rural
What struck me most in the summary by Utility for FY23 was the customer growth at Endeavour, Powercor and Ausnet over the past five years:

The best customer growth has been in the regional areas.
In my view Endeavour’s growth around 100k resi connections is particularly noteworthy and reflects where NSW population has grown in the past few years.

Where non nerds fear to dread
Looking at some detail. For instance:
The makeup of RAB by class of asset.

Not only are overhead wires the biggest part of the RAB mix they are also by far the fastest growing in $ terms, increasing $9 bn over five years.
Likely this is due to the population growth in regional areas rather than in higher density areas, but it’s still going to represent a big maintenance expense down the track. To be sure underground assets are increasing at the same growth rate, but the $ are a lot less.
Breaking up revenue by function:

Maximum demand charges are the strongest growing part of revenue but revenue growth is uninspiring to be sure. Utilities are also moving customers onto time of use as can be seen in the strong decline the “where time is not a determinant” category. Shoulder charges are included in half a dozen items in “other” category.
From one point of view its completely reasonable to drive incentives via demand and time of use.
However, from another point of view and ignoring the regressive impact the wires and poles sector is a fixed asset where, as we have seen, in Figure 5 substations, both zone and smaller are only the smaller part of RAB and, in my opinion, substation asset value growth is related to network expansion via population growth, as opposed to putting more energy through the same station.
Therefore driving consumers to consume less, or even driving them to minimise demand may not be the best way.
A greater emphasis on fixed charges, and building those charges, into say the cost of the property when it is developed might be a better way. In that way customers would pay much less in the way of annual costs and much more upfront.
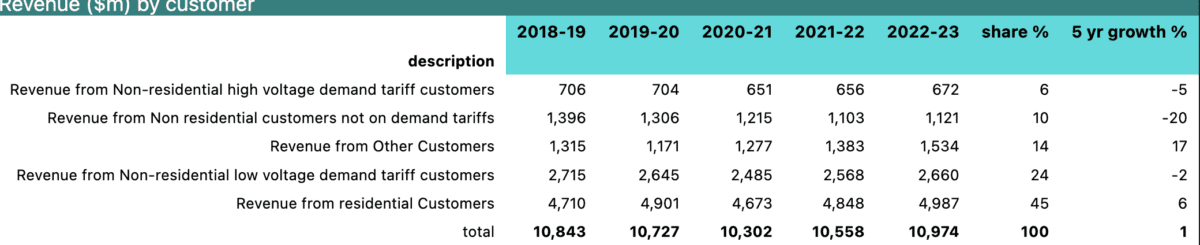
Residential customers are 45% of revenue
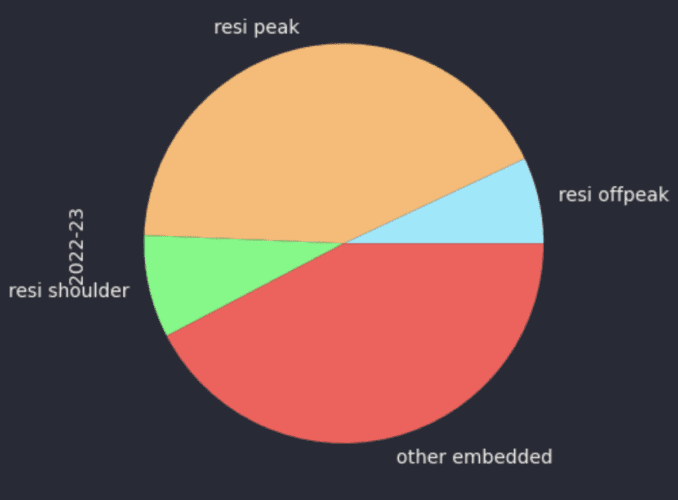
DNSPs appear to get 10 TWh from behind the meter
Over the year ended 15 April, 2024 rooftop solar production was as much as 24 TWh. For the year to June 2023 according to the RIN statements the distribution utes received 10.3 TWh or about 42%.
However, I find it strange that Ausgrid reports receiving only 1 TWh from its customers compared to Energex 2.6 TWh. Both are capital city distributors. Ausgrid also gets less than Essential Energy a much smaller network in terms of total energy. Still….

Equally, it’s a bit surprising to find so much of the behind the meter generation comes at peak and from sources other than resi. The “other embedded” may include diesel and gas generation (eg cogen) but until time permits an opportunity to chase this rat up a drain pipe I’m treating the numbers cautiously.
Opex – not enough standardisation
Unfortunately spelling errors, and generally non standardised expense categories make drilling down more subjective than objective. Nevertheless, I took the time to fiddle with the data and the estimated six largest expense categories are: