The Coalition is making unproven assertions that 100% ‘zero emissions’ electricity can be provided more cheaply and reliably by nuclear than renewable energy. It has even proposed sites for nuclear reactors, including Collie in Western Australia, which currently has three coal fired power stations.
This article compares weighted average levelized cost of energy (WALCOE) for nuclear grid scenarios, with those of renewable energy (RE) grid scenarios for Western Australia’s South West Integrated System (SWIS). The modelled scenarios deliver 95% and 100% near zero emissions energy (Table 1)
Much has been written about the impediments to nuclear in Australia, including laws prohibiting it, storage of nuclear waste, costly insurance/ underwriting of plants, 10-15 year lead time, the unavailability of commercial small modular reactors and likely cost overruns, all of which would add to the cost.
LCOE modelling does not include any of these ‘externalized items’ and therefore considerably underestimates the real cost of nuclear.
In this analysis I have used the renewable energy modelling software SIREN and my LCOE modelling software PowerBalance2, which uses the formula: WALCOE of grid scenario = (sum annualized amortized capital costs plus fixed costs plus variable costs including fuels, of all power stations) / grid annual energy demand.
Capital costs, technology, life time and interest rates are from CSIRO, 2024 Gen Cost draft report, 2024. (Appendices B2, B5, B6).
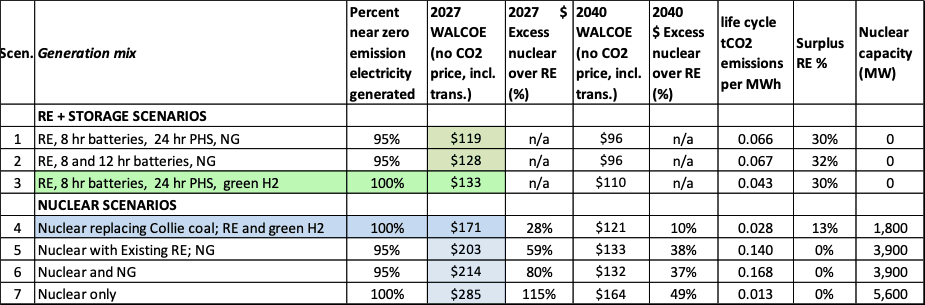
From Table 1 it is clear that scenario 1, ‘RE generation with 8 hour batteries plus 24 hr pumped hydro storage (PHS)’ would deliver the lowest cost 95% near zero emissions (NZE) scenario at $119/MWh.
Converting the OCGT generation to green hydrogen (H2) at an assumed cost of 5 times natural gas gives a 100% scenario costing $133/ MWh, which is still 28% cheaper than replacing Collie coal with nuclear and provides the rest of the energy requirements with RE.
All scenarios assume 1.66 times 2017 demand, which should be enough to cover 2030 demand including vehicle electrification.
The RE scenarios provide the additional benefit of 30% surplus generation, which could be used to produce hydrogen by electrolysis.
RE scenario 1 has 6,100 MW of wind, 6,700 MW of solar PV including 2,500 MW on rooftops, 1,200 MW of 8 hour batteries and 1,400 MW of 24 hour PHS storage. Storage could be provided using 8 hour batteries (scenario 2) but costs 8% more.
The W.A. state government apparently sees no urgency to achieve even the 82% RE they promised by 2030. They are stuck on about 1,300 MW of wind and about 2,000 MW of mainly rooftop PV generation by 2027.
I would only give them a tick for battery storage, where there is 750 MW installed or under construction. Their priority seems to be prolonging the use of gas for the benefit of their mates in the industry.
The lowest cost nuclear option is replacing the existing 1550 MW of coal generators at Collie/ Muja with 1800 MW of nuclear, assumed to be small 300 MW units, allowing one to cover down time.
If this were commenced in 2027, the earliest possible for a Coalition government to initiate it, renewable energy installation would slow from that date and the nuclear plant would not be completed until after 2040. Table 1 shows the cost of this scenario is $171/ MWh, 28% higher than ‘RE with batteries and pumped hydro (PHS)’.
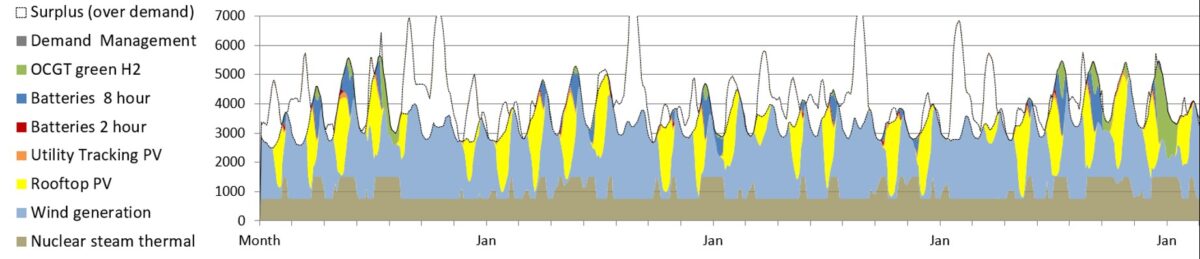

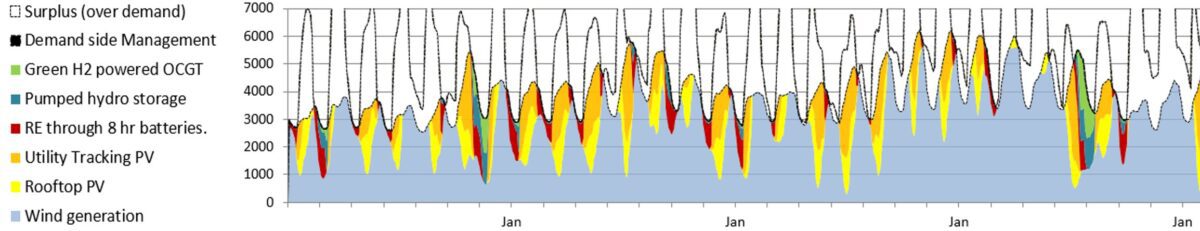
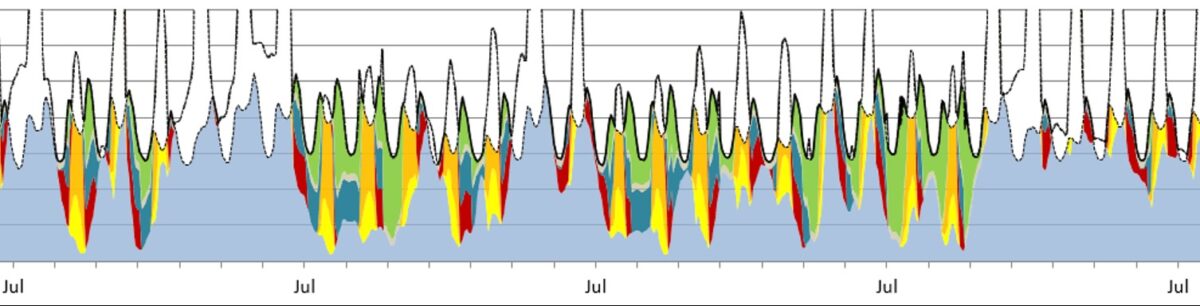
Due to its inability to switch on and off and ramp below 50%, nuclear has to continue to generate even when much lower cost RE is available and has to be spilled (See Figure 2). This is the major issue that makes nuclear unsuitable for integration with RE.
‘Nuclear with Existing RE’, (scenario 5 in Table 1) is the other ‘less implausible’ scenario. RE build is curtailed in 2027 and 3900 MW of nuclear would be completed after 2040. This would provide electricity at $203/ MWh, which is 59% higher the RE scenario 1.
Scenarios 6 and 7 – ‘Nuclear and natural gas’ and ‘Nuclear only’ – are included for cost comparison only. They could never be implemented as the electricity cost is exorbitant – 80% and 115% respectively higher than the RE equivalent scenarios.
Also, existing and planned RE – about 1300 MW of wind and 2000 MW of mainly rooftop PV – would have to be decommissioned.
The unthinkable situation of doing nothing until 2040 then waiting until 2055 for a nuclear near zero emissions grid was also modelled (Table 1 column 5).
The CSIRO GenCost forecasts that all capex costs will fall and that nuclear cost will decline most (from $21.2 million to $11.2 m / MWh). LCOEs of scenarios 4 -7 with increasing amounts of nuclear were still 10% – 49% higher than the corresponding RE scenarios.
This analysis has been overly generous to nuclear. The costs of radioactive waste disposal and Government underwriting have not been included.
There are unrealistic assumptions that small nuclear reactors could actually be constructed at the reducing costs predicted by GenCost without over-runs and that there would be no new transmission and connection costs for the high nuclear scenarios.
Nevertheless, even omitting these externalized costs, all nuclear scenarios are still more expensive than those based on wind and solar generation, which do not incur cost over-runs and have proved reliable.
In conclusion the most cost effective near zero electricity (NZE) scenarios for the WA SWIS grid are 95% and 100% RE generation, 95% being achievable by 2035.
The 100% scenario is essentially the same as ‘95% RE with battery + PHS’, with stored green hydrogen replacing natural gas (NG) to fuel the OCGTs.
The only slight advantage of the Collie nuclear 100% NZE scenario 4 is its slightly lower emissions intensity (0.028 compared to 0.043 tCO2 per MWh), due to lower embodied emissions of the infrastructure.
But the Coalition’s nuclear dreams will never be worth paying 30% to 100% more, waiting more than 20 years and dealing with the waste.
Ben Rose is a W.A. based energy and emissions analyst
Modelling Assumptions:
- All technology CAPEX figures are CSIRO’s ‘Global NZE post 2050’ estimates.
- Cost of capital 5.9% (except for PHS, 4.5%).
- All scenarios are modelled with 1.66 times 2017 demand
- All scenarios include 900 – 1000 MW of demand management.
- Emission factors(EFs) for all generation and storage technologies include fossil fuel emissions from embodied energy, as renewable metal technologies are assumed not to be commercial until after 2050.
- Nuclear power is supplied by 300 MW small reactor units.
- To cover an assumed outage rate of 18%, scenario 1 has one 300 MW standby nuclear unit. Scenarios 4, 5 have one 300 MW nuclear unit plus 300 MW of OCGT; scenario 6 has two 300 MW standby nuclear units.
- Nuclear can operate at a minimum 50% capacity and ramp quickly to 100%.
- No new transmission required for nuclear scenarios
- RE data is from NASA MERRA database
- Wind energy is modelled using 4 MW onshore turbines
- 95% RE scenarios require 1000 km of new transmission at $4.5 million per km all inclusive, equating to $9.60/ MWh. 100% RE requires 1500 km of new transmission at $4.5 million per km, equating to $14.40/ MW.
- Assumed cost of green H2 is $35/GJ (about 5 times the2024 price of NW shelf gas)