Solar duck curves are becoming an increasingly dominant feature in grids across the globe, particularly those with huge amounts of rooftop solar. Australia and California feature among them, but nowhere is the impact as marked as in Western Australia, host to what is regarded as the world’s biggest isolated grid.
A fascinating new report on the last quarter’s operations on WA’s main grid, the South West Interconnected System, and the Wholesale Electricity Market that operates within it, highlights the radical changes in the shape of the local grid, and the profound shift from a system based around “baseload” power concepts.
“The shape of the WEM demand curve has irrevocably changed,” writes Ampere Lab principal consultant Julius Susanto, a former principal engineer at the Australian Energy Market Operator and technical director at the Australian Energy Market Commission (AEMC).
“Despite a hot summer where peak demand records tumbled, the effects of rooftop solar on the shape of the system demand curve is unmistakeable, even on the hottest days.
“In past summers, the WEM demand curve used to have a single hump that gradually rises through the day and peaks in the later afternoon (at 4-5pm). But rooftop solar has eaten away at the demand in the middle of the day and a two-humped demand curve is now the norm, with the peak shifting later into the evening (at 6-7pm).”
These graphs below highlight the impact.
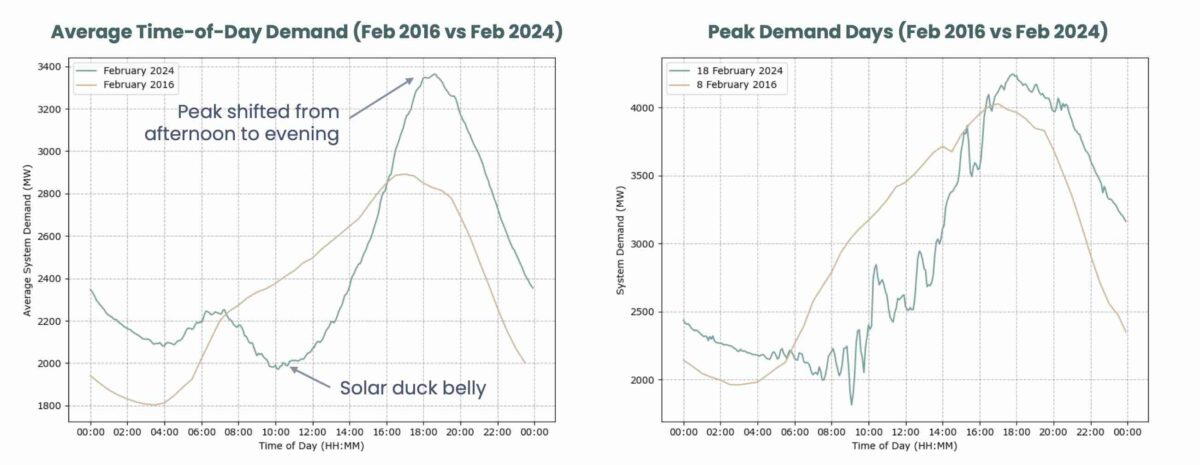
This belly of the duck is getting bigger and deeper, Susanto writes, to the point where the WEM can flip – as it did in February this year – from a then record peak demand of 4,175 MW on one day, and drop to a minimum of just 800 MW a few days later.
The response to this is not more baseload – the state’s remaining coal fired power stations are expected to close before the end of the decade in any case – but fast and flexible dispatchable capacity.
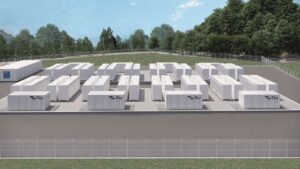
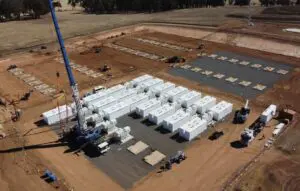
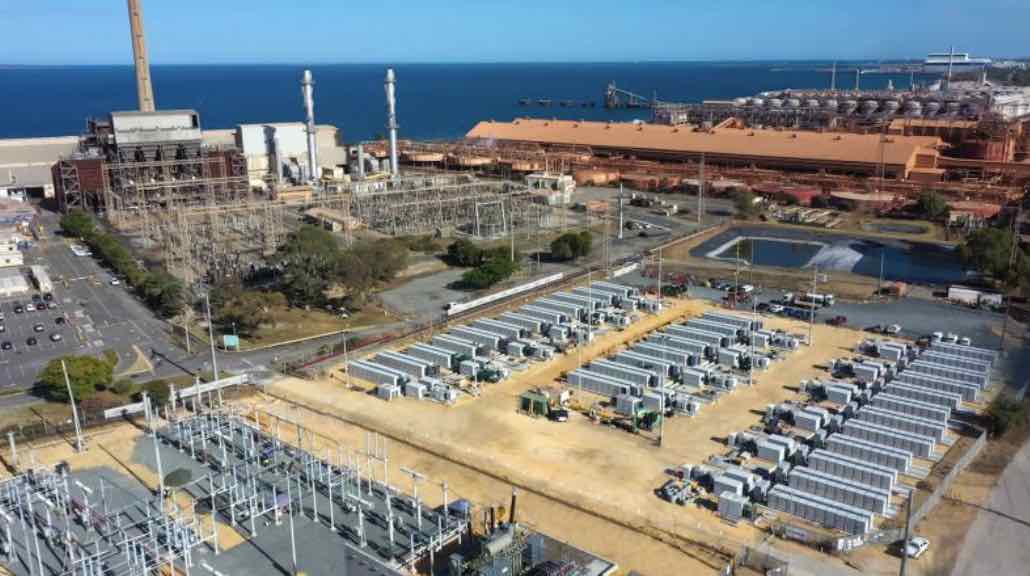
And that will come in the form of a fleet of big batteries, the first of which – the 100 MW, 200 MWh Kwinana big battery – has just completed its first summer of operation.

Susanto’s report notes that so far – and despite a “small fire” that delayed its commissioning – the Kwinana battery has been operating pretty much as expected, charge up during the day and overnight and discharging into the evening peak (and sometimes the morning peaks too).
Kwinana will soon be followed by at least another four big batteries that will boost the battery storage capacity in the WEM nearly 20-fold, with the construction of a 200 MW, four hour (800 MWh) stage two battery at Kwinana and Synergy’s 500 MW, four hour (2,000 MWh) at Collie.
Neoen is also building its first four hour battery, a 219 MW, 867 MWh battery, also at Collie, and Alinta is building the 100 MW, 200 MWh, Wagerup battery.
All have signed lucrative contracts to perform a specific task to try and flatten that solar duck, or at least the duck’s belly, by soaking up solar in the middle of the day and putting it back into the grid in the evening peaks.
Susanto says the Kwinana stage 1 battery is already having a small but visible impact on the demand curve.
“You can see notches in system demand during charge cycles,” he tells RenewEconomy. “It’s not big or deep enough to make a dent on the duck curve, but I would expect some flattening to occur when the Collie, KBESS2 (Kwinana stage 2) and Wagerup batteries come online.”
Rooftop solar currently accounts for around 20 per cent of the WA’s grid generation, putting it at number three behind coal and gas, and just ahead of wind, and more than 10 times more than large scale PV.
Its share of rooftop PV is second only to South Australia, where rooftop PV has – at times – created an even deeper duck curve by meeting all the state’s demand.
But South Australia is linked to another grid, Victoria, and soon will be connected to NSW as well. WA has a bigger grid but with no links, and none probable unless a line can be strung across the Nullarbor, and so it can’t allow that rate of solar penetration to occur.
Even at current levels, rooftop PV is influencing most other generators.

Coal fired generators, as they do in other states, have to dance around rooftop PV, but in WA these are no small steps. Some generators are being forced to switch off, and the impact on their economics and maintenance costs is another reason for them to shut down (on top of dwindling coal supplies, costs and pollution).
This graph above shows how the 318 MW Collie fired generator owned by Synergy was operating in the first quarter.
It appears to have little in the way of ramping abilities, and zero tolerance for minimal output, so it chooses instead to switch off. Its average capacity factor over the first quarter has been 30 per cent. Many of the wind farms in the state have had average capacity factors of 50 per cent. So much for “base-load.”
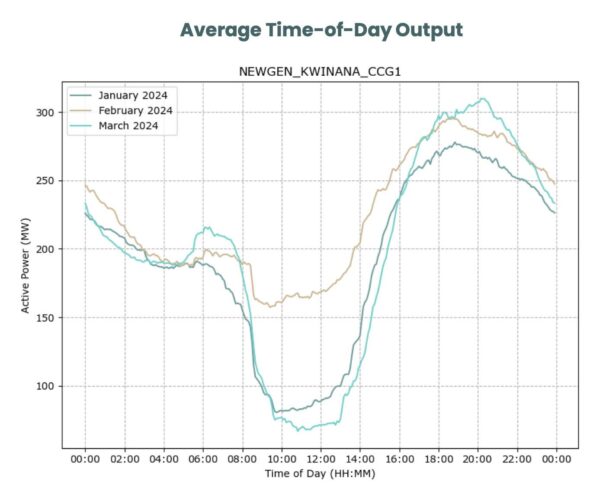
This graph by Ampere Labs shows the NewGen combined cycle gas plant (nominally a baseload/intermediate facility) generator, and it illustrates how it, too, has been forced to replicate the deep solar duck curve in its own operations.
Of course, this has serious implications to the growing debate in Australia, pushed by the Coalition and right wing think tanks and media keen to stop the roll out of renewables.
That argument is being pushed the argument that Australia’s grid will need “baseload” power to act as filler for renewables. But large scale nuclear has shown no ability to dance like this, and no inclination to do so because it would destroy its economics, already perilous, which rely on constant output.
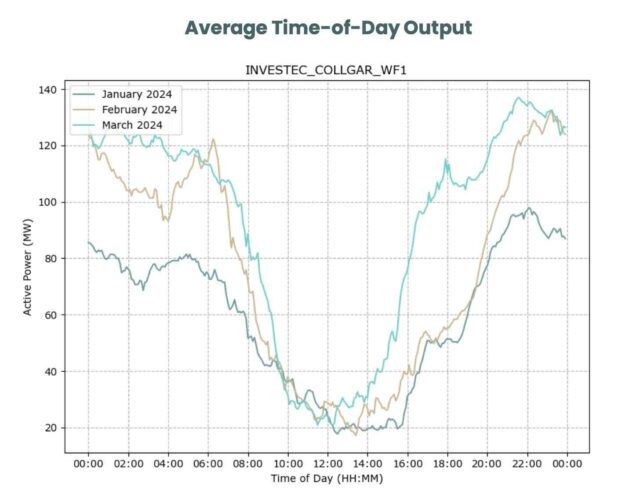
Back in W.A., wind power also appears to be dancing around rooftop solar, but the reality is that its output is mostly influenced by the prevailing wind conditions in the WEM (mostly at night, not so much during the day), and various grid constraints.
This graph illustrates the average output for the first three months of 2024 from the state’s largest wind farm, the 218 MW Collgar facility near Merredin, which had an average capacity factor of 38 per cent, although others like Warradarge and Yandin to the north had average CFs of 50 per cent or more.
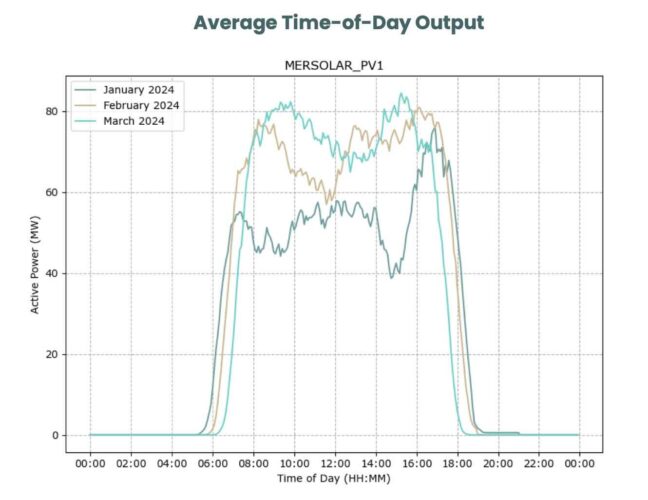
Not far away from that wind facility is the state’s biggest solar farm, the 100 MW Merredin facility that shows a different output altogether (see graph above) and appears unaffected by rooftop solar and subject to variation only from weather conditions and maybe network constraints.
It had a capacity factor of just over 30 per cent in the first quarter, slightly more than the Collie coal generator further south.
Still, according to Ampere Labs, utility scale solar accounted for just 1.6 per cent of the main grid’s generation in the first three months of the year – a pitifully small amount considering that W.A. played host to the very first utility-scale solar farm in the country when it opened the then 10 MW Greenough River solar farm in 2012.